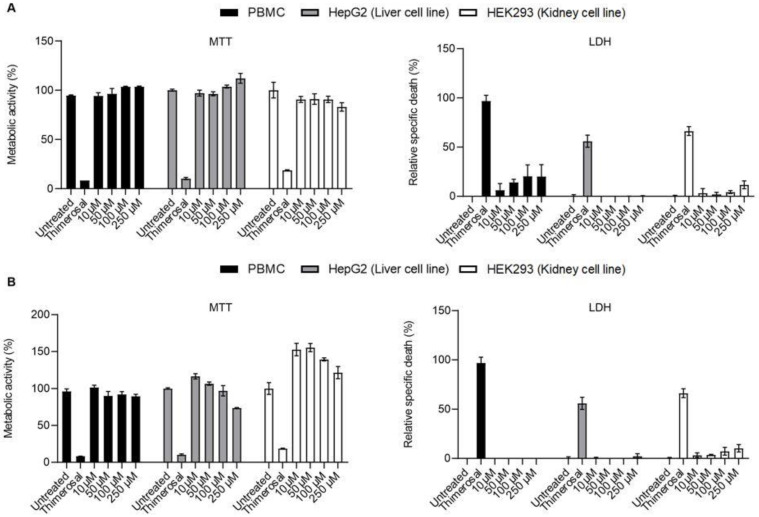
Figure 6.
MTT (left) and LDH (right) results for PBMC (Black), Hep G2 (Grey), and HEK-293 (White) using high concentration (up to 250 µM) of KB-151 (A) and KB-208 (B). Y-axis for MTT graph shows the percentage of metabolic activity which is related to the cell viability, and for LDH graph, it shows the percentage of relative specific death which related to the cell toxicity. X-axis of both MT and LDH show different concentrations of KB-151 and KB-208, Thimerosal at 100 µM as control toxicity (**** p ≤ 0.0001), and untreated control. Bars represent mean ± SD, and N = 3.

