Abstract
Aim
Cardiovascular disease (CVD) remains one of the leading causes of mortality worldwide, and several studies have indicated the association between socioeconomic status (SES) with CVD and cardiovascular risk factors (CVRFs). It is necessary to elucidate the association of SES and CVRFs with CVD.
Subject and methods
We searched PubMed, Embase, Web of Science, and the Cochrane Library for publications, using “socioeconomic status,” “cardiovascular disease,” and corresponding synonyms to obtain literature. The quality of studies was evaluated using the National Institutes of Health Quality Assessment Tool (NIH-QAT). All analyses were performed using Stata V.12.0.
Results
There were 31 eligible studies included in this meta-analysis. All studies presented a low risk of bias via NIH-QAT assessment. As for CVD incidence/mortality, pooled hazard ratios (HR) of low and middle vs. high income were [HR = 1.22 (1.17–1.28); HR = 1.12 (1.09-1.16)] and [HR = 1.37 (1.21–1.56); HR = 1.19 (1.06–1.34)]. The HR of education were [HR = 1.44 (1.28–1.63); HR = 1.2 (1.11–1.3)] and [HR = 1.5 (1.22–1.83); HR = 1.13 (1.05–1.22)]. The HR of deprivation were [HR = 1.28 (1.16–1.41); HR = 1.07 (1.03–1.11)] and [HR = 1.19 (1.11–1.29); HR = 1.1 (1.02–1.17)]. SES was negatively correlated with CVD outcomes. A subgroup analysis of gender and national income level also yielded a negative correlation, and additional details were also obtained.
Conclusions
SES is inversely correlated with CVD outcomes and the prevalence of CVRFs. As for CVD incidence, women may be more sensitive to income and education. In terms of CVD mortality, men may be more sensitive to income and education, and people from low- and middle-income countries are sensitive to income and education.
Supplementary Information
The online version contains supplementary material available at 10.1007/s10389-023-01825-4.
Keywords: Cardiovascular disease, Cardiovascular risk factors, Socioeconomic status, Meta-analysis
Introduction
Significant advances have recently been achieved in cardiovascular disease (CVD) management, but CVD is still one of the leading causes of death globally. The morbidity and mortality of CVD remain high in both developed and developing countries (Goswami et al. 2021), posing a major burden on global health, society, and finance (Timmis et al. 2022; Townsend et al. 2022). Extensive studies have demonstrated that CVD may be associated with socioeconomic status (SES) and cardiovascular risk factors (CVRFs) (Havranek et al. 2015; Kaplan and Keil 1993; Woodward et al. 2007; Hippisley-Cox et al. 2008). Thus, it is necessary to investigate the association of SES with CVD and CVRFs.
Some previous meta-analyses assessed the relationship between SES and CVD only by exploring limited aspects of CVRFs, such as gender, education, and income(Khaing et al. 2017; Backholer et al. 2017), rather than comprehensively analyzing the underlying association among them. In addition, there is no meta-analysis to systematically analyze the association considering different income levels in different countries. The latest review we retrieved was published in 2018 (Schultz et al. 2018), which is four years ago. Due to the COVID-19 epidemic since 2019, the economies of countries worldwide have been affected to various degrees, resulting in a widening gap between country economies, which may present a deviation of previous research results from the current situation. We believe that a meta-analysis is needed to update the results of previous studies and further elucidate the relationship between SES, CVRFs, and CVD, hoping to provide a theoretical basis for the treatment and prevention of CVD in the future.
Methods
This study was carried out based on the Cochrane Handbook for the Systematic Review of Interventions (for details, see http://training.cochrane.org/handbook) and the Preferred Reporting Items for Systematic Reviews and Meta-Analyses Statement (PRISMA)(Moher et al. 2009). The research protocol was registered on PROSPERO (ID: CRD42022352904).
Inclusion and exclusion criteria
Research types
The research types included observational cohort and cross-sectional studies.
Research participants
The research participants were enrolled when cases were at (1) age ≥ 18 years old, and (2) had no other major diseases other than CVD.
Intervention measures
(1) The SES indicators of the exposed group were at low or medium levels in the research group. The SES indicators of the observation group were at a high level in the research group. (2) The observation period was longer than or equal to 12 months.
Outcomes and study factors
The outcomes of our study were CVD incidence and mortality. SES, including income, education, and deprivation, was our study factor, which was reported differently across studies.
To standardize data for included studies, if original studies reported SES as quartiles or four groups, the 1st, 2nd+3rd, and 4th quartiles or groups were reclassified into three groups: low, middle, and high, respectively. If studies reported SES as quintiles or five groups, the 1st+2nd, 3rd+4th, and 5th quintiles or groups were reclassified as low, middle, and high, respectively. When a study reported a reference group, which was not the highest SES group, the relevant HR and 95% confidence intervals (CI) were recalculated using the highest one as a reference, utilizing a method developed by Hamling et al. (2008). Based on the income classification by World Bank, we divided the countries selected for our research into low- and middle-income countries (LMICs) and high-income countries (HICs).
Exclusion criteria
(1) SES was not addressed or SES indicators were not stated; (2) Duplicated studies (for overlapping data, the latest published study and/or the one with the largest sample size would be selected); (3) Reviews, conference abstracts, case reports, letters, animal tests, etc.; and (4) Studies published were not written in English.
Search strategy
A researcher systematically searched PubMed, Embase, Web of Science, and the Cochrane Library for publications prior to March 24, 2022, using predefined keywords and Medical Subject Headings (MeSH), including “socioeconomic status,” “cardiovascular disease,” and their synonyms to obtain relevant literature. Due to the long time spent on data processing, we conducted a complementary search on August 5, 2022, using the same search terms as the above described. Furthermore, potential candidate papers were manually checked in the references of the included studies. This study does not require ethical approval or patient consent. Online Resource 1 outlines the search strategy in detail.
Review for inclusion
Two researchers independently examined the eligibility and screened the titles and abstracts of all identified potential studies. Then, the two researchers continued with a full-text review to finalize the study selection. If there was any disagreements, a common decision was made together with a third researcher.
Data extraction and quality assessment
Data were extracted from each eligible study by two researchers. Any disagreements were resolved through discussion with a third reviewer to ensure the validity of the research results. Extracted data included authors, year of publication, country, sample size, gender, exposed group, observation group, SES indicators, and outcome indicators.
Two researchers independently evaluated the quality of included studies using the National Institutes of Health Quality Assessment Tool (NIH-QAT) (available from https://www.nhlbi.nih.gov/health-topics/study-quality-assessment-tools), including 14 items, such as “Are the study issues or objectives identified in this article?”, etc., and any inconsistencies or disputes were settled by a third reviewer. Each study was assessed as low risk of bias (most criteria met), middle risk of bias (some criteria met), or high risk of bias (few criteria met).
Statistical analysis
Stata 12.0 software was adopted to perform statistical analysis of the included literature, such as the tests for heterogeneity, publication bias analysis, and sensitivity analysis. To compare the highest group with the lowest or middle group of SES, HR, and 95%CI were calculated using a logarithmic transformation. Heterogeneity was determined using the Q statistic and I2 tests. If P > 0.1 and I2 ≤ 50%, the heterogeneity between studies was acceptable, and a fixed effects model was adopted for meta-analysis; If P ≤ 0.1 or I2 > 50%, heterogeneity between studies was high, and a random effects model was employed for meta-analysis.
Results
Study selection
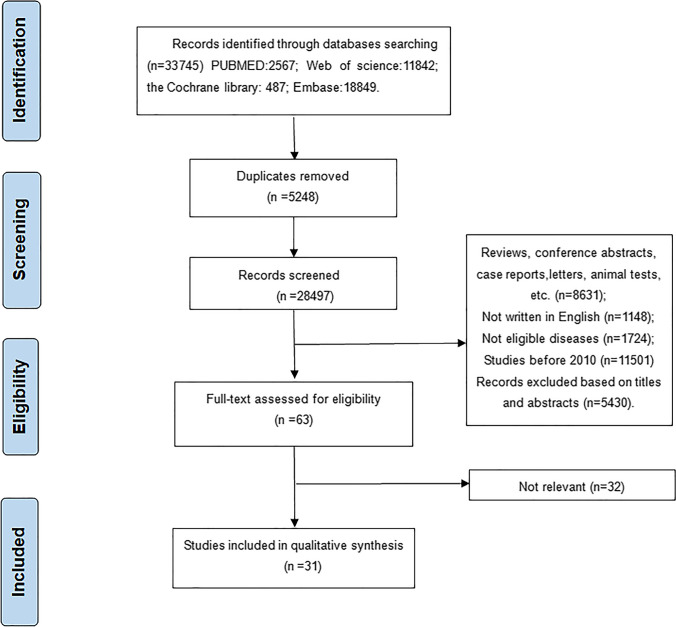
Records from all retrieved search results were downloaded and merged with Endnote version X9. A total of 33,745 potentially relevant studies were initially detected through database searches (PubMed n = 2567, Embase n = 18,849, the Cochrane Library n = 487, and Web of Science n = 11,842). After excluding 5248 repeated studies during an initial evaluation, we subsequently excluded 11,501 studies published before 2010. Given the world’s economic development and changes in people’s living standards, such studies before 2010 may not be suitable for the current situation. Meanwhile, 2872 articles were not written in the English language or did not conform to disease studies, and 8631 articles were reviews, conference abstracts, case reports, letters, and animal tests, which were ruled out. The remaining literature was further screened for titles, abstracts, and full texts, and 5462 studies were excluded. Ultimately, 31 studies published between 2010 and 2022 were included. The literature identification process is demonstrated in Fig. 1.
Fig. 1.
Flow chart of study inclusion identification
Study characteristics
A total of 31 studies (Deguen et al. 2010; Gerber et al. 2010; Christensen et al. 2011; Donyavi et al. 2011; Sauvaget et al. 2011; Blais et al. 2012; Koopman et al. 2012; Machón et al. 2012; Masoudkabir et al. 2012; van Oeffelen et al. 2012; Alter et al. 2013; Quan et al. 2013; Coady et al. 2014; Wang et al. 2014; Thorne et al. 2015; Floud et al. 2016; Kilpi et al. 2016; Colantonio et al. 2017; Kilpi et al. 2017; Cho et al. 2019; Geyer et al. 2019; Kjærulff et al. 2019; Kriegbaum et al. 2019; Rosengren et al. 2019; An et al. 2020) were included, and the studies on HICs were in the majority, while few studies focused on LMICs. Each study had a large sample size, and all analyzed both women and men with one exception, which only focused on the factors related to women. Through a comprehensive assessment of the included studies, SES indicators, including income, education, and deprivation index, were determined. The summary of the basic characteristics of the included studies is presented in Table 1.
Table 1.
Study characteristics
| Author (year) | Country | Total sample size | Gender | Exposure group | Observation group | SES* indicators | Outcome indicators |
|---|---|---|---|---|---|---|---|
| Wang et al.(2014) | China | 23568 | Both |
Low Middle |
High | Income | Mortality |
| Van Oeffelen et al.(2012) | Holland | 76351 | Both |
Quintile 5 Quintile 4 Quintile 3 Quintile 2 |
Quintile 1 | Income | Mortality |
| Koopman et al.(2012) | Holland | 317564 | Both |
Quintile 5 Quintile 4 Quintile 3 Quintile 2 |
Quintile 1 | Income | Incidence |
| Tetzlaff et al.(2021) | German | 1253083 | Both |
Low Middle |
High | Income | Incidence and mortality |
| Geyer et al.(2019) | German | 18390577 | Both |
Low Middle |
High | Income | Incidence and mortality |
| Sung et al. (2020) | Korea | 178812 | Both |
Low Middle |
High | Income | Mortality |
| Hassen et al.(2020) | Belgium, France | 14322 | Both |
Low Middle |
High | Income | Incidence |
|
Low Middle |
High | Education | |||||
| Coady et al.(2014) | Ameirica | 15972 | Both |
Quintile 1 Quintile 2 Quintile 3 Quintile 4 |
Quintile 5 | Income | Mortality |
| Cho et al.(2019) | Korea | 2705090 | Both |
Low Middle |
High | Income | Incidence |
| Alter et al.(2013) | Canada | 1368 | Both |
Low Middle |
High | Income | Mortality |
| Rosengren et al.(2019) | America, China, Tanzania and other 17 countries | 154169 | Both |
Poorest third Middle third |
Richest third | Income | Incidence and mortality |
|
None or primary only; Secondary |
Trade school, college, or university | Education | |||||
| Masoudkabir et al.(2012) | Iran | 6504 | Both |
1st tertile 2nd tertile |
3rd tertile | Income | Incidence |
|
0–5 years 6–12 years |
>12 years | Education | |||||
| Quan et al.(2013) | Canada | 3531089 | Both |
Quintile 1 Quintile 2 Quintile 3 Quintile 4 |
Quintile 5 | Income | Incidence |
| An et al.(2020) | Ameirica | 77101 | Both |
$0–$34.9k; $35k–$49.9k; $50–$64.9k; $65k–$79.9k; |
≥$80k | Income | Incidence |
| Machado et al. (2021) | Ameirica | 5579 | Both |
Quintile 1 Quintile 2 Quintile 3 Quintile 4 |
Quintile 5 | Income | Incidence |
| Kjærulff et al.(2019) | Denmark | 95274 | Both |
Low Middle |
High | Income | Mortality |
| Sauvaget et al.(2011) | India | 167331 | Both |
<₹1500; ₹1500-₹3000; ₹3001-₹5000; |
>₹5000 | Income | Mortality |
| Christensen et al.(2011) | Denmark | 18486 | Both |
<8 years; 8-10 years |
>10 years | Education | Incidence |
| Ge et al.(2022) | China | 4725 | Both |
Low Middle |
High | Income | Mortality |
|
Low Middle |
High | Education | |||||
| Donyavi et al.(2011) | Iran | 1283 | Both |
Illiterate; 1-5 years; 6-9 years; 10-12 years; |
> 12 years | Education | Mortality |
| Kilpi et al.(2017) | Finland | 94501 | Both |
Quintile 5 Quintile 4 Quintile 3 Quintile 2 |
Quintile 1 | Income | Incidence |
|
Basic Secondary |
Tertiary | Education | |||||
| Kriegbaum et al.(2019) | Denmark | 1235142 | Both |
Quartile 1 Quartile 2 Quartile 3 |
Quartile 4 | Income | Incidence |
|
1st tertile 2nd tertile |
3rd tertile | Education | |||||
| Kilpi et al.(2016) | Finland | 302885 | Both |
Quintile 5 Quintile 4 Quintile 3 Quintile 2 |
Quintile 1 | Income | Incidence and mortality |
|
Basic; Secondary; Lowest tertiary; |
Higher and lower tertiary | Education | |||||
| Floud et al.(2016) | UK | 1202983 | Bemale |
Quintile 5 Quintile 4 Quintile 3 Quintile 2 |
Quintile 1 | Deprivation index | Incidence and mortality |
|
< Compulsory schooling; Compulsory schooling; Technical; Secondary |
Tertiary | Education | |||||
| Deguen et al.(2010) | France | 1193 | Both |
Quintile 5 Quintile 4 Quintile 3 Quintile 2 |
Quintile 1 | Deprivation index | Incidence |
| Colantonio et al.(2017) | Ameirica | 9066 | Both |
Quartile 4 Quartile 3 Quartile 2 |
Quartile 1 | Deprivation index | Incidence |
| Jin et al.(2021) | Scotland | 217965 | Both |
Quintile 5 Quintile 4 Quintile 3 Quintile 2 |
Quintile 1 | Deprivation index | Mortality |
| Thorne et al.(2015) | UK | 30663 | Both |
Quintile 5 Quintile 4 Quintile 3 Quintile 2 |
Quintile 1 | Deprivation index | Mortality |
| Machón et al.(2012) | Spain | 3974 | Both |
Quintile 5 Quintile 4 Quintile 3 Quintile 2 |
Quintile 1 | Deprivation index | Mortality |
| Blais et al.(2012) | Canada | 53130 | Both |
Quintile 5 Quintile 4 Quintile 3 Quintile 2 |
Quintile 1 | Deprivation index | Mortality |
| Gerber et al.(2010) | Israel | 1179 | Both |
Low Middle |
High | Deprivation index | Mortality |
*SES, socioeconomic status
Results of the quality assessment
Based on the NIH-QAT checklist, all included studies presented a low risk of bias. The least frequently reported item in the included studies was “item 13.” “Item 10” and “item 12” were not applicable. Further information about the risk of bias assessment is described in Online Resource 2.
The results of meta-analysis
A meta-analysis was conducted to investigate the relationship between SES and CVD outcomes through the aspects of income, education, and deprivation. More detailed information is presented in Online Resource 3.
Income and CVD outcomes
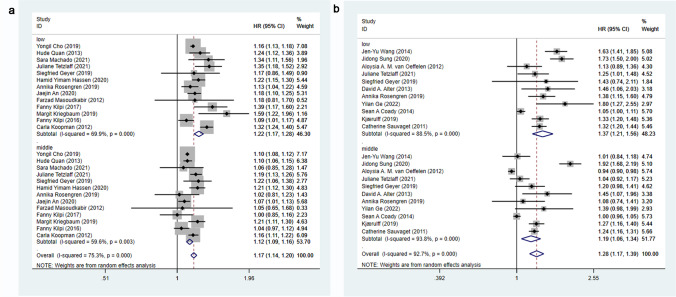
Twenty-one studies (Sauvaget et al. 2011; Koopman et al. 2012; Masoudkabir et al. 2012; van Oeffelen et al. 2012; Alter et al. 2013; Quan et al. 2013; Coady et al. 2014; Wang et al. 2014; Kilpi et al. 2016, 2017; Cho et al. 2019; Geyer et al. 2019; An et al. 2020) assessed the effects of income on CVD outcomes. A random-effects model (I2 = 75.3%, P = 0.000; I2 = 92.7%, P = 0.000) was adopted to combine the effect sizes, and the analysis results revealed that the risk of CVD incidence in low- and middle-income groups was 22% and 12% higher than that in the high-income group, respectively [HR = 1.22, 95%CI (1.17, 1.28); HR = 1.12, 95%CI (1.09, 1.16)]. Meanwhile, the risk of CVD mortality in low- and middle-income groups was 37% and 19% higher than that in the high-income group, respectively [HR=1.37, 95%CI (1.21, 1.56); HR = 1.19, 95%CI (1.06, 1.34)]. The effects of income on CVD incidence and mortality are shown in Fig. 2.
Fig. 2.
(a) Effects of income on CVD incidence (b) Effects of income on CVD mortality
Education and CVD outcomes
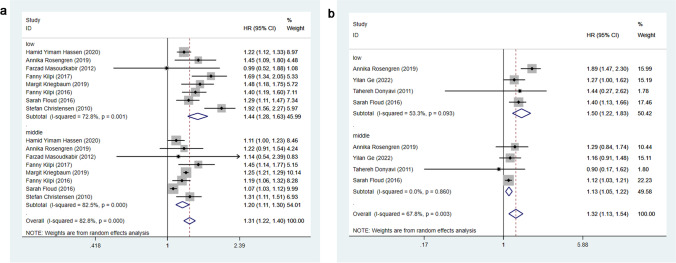
Ten studies (Christensen et al. 2011; Donyavi et al. 2011; Masoudkabir et al. 2012; Floud et al. 2016; Kilpi et al. 2016, 2017; Kriegbaum et al. 2019; Rosengren et al. 2019; Hassen et al. 2020; Ge et al. 2022) assessed the effects of education on CVD outcomes. A random-effects model (I2 = 82.8%, P = 0.000; I2 = 67.8%, P = 0.003) was adopted to combine the effect sizes, and the analysis results revealed that the risk of CVD incidence in low- and middle-education groups was 44% and 20% higher than that in the high-education group, respectively [HR = 1.44, 95%CI (1.28, 1.63); HR = 1.20, 95%CI (1.11, 1.30)]. In addition, the risk of CVD mortality in low- and middle-education groups was 50% and 13% higher than that in the high-education group, respectively [HR = 1.50, 95%CI (1.22, 1.83); HR = 1.13, 95%CI (1.05, 1.22)]. The effects of education on CVD incidence and mortality are shown in Fig. 3.
Fig. 3.
(a) Effects of education on CVD incidence (b) Effects of education on CVD mortality
Deprivation and CVD outcomes
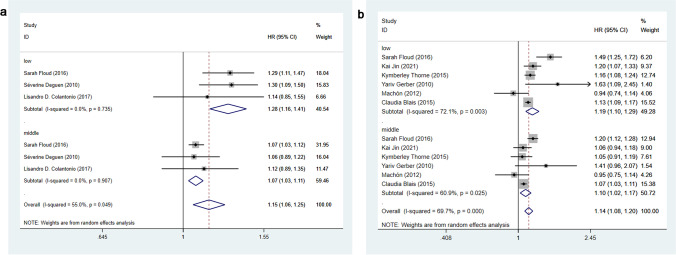
Eight studies (Deguen et al. 2010; Gerber et al. 2010; Blais et al. 2012; Machón et al. 2012; Thorne et al. 2015; Floud et al. 2016; Colantonio et al. 2017; Jin et al. 2021) assessed the effects of deprivation on CVD outcomes. To facilitate the analysis and comparison of other SES indicators, the low group was considered to have the highest deprivation index, that is, the lowest SES. The high group was regarded as having the lowest deprivation index, that is, the highest SES. A random-effects model (I2 = 55.0%, P = 0.049; I2 = 69.7%, P = 0.000) was adopted to combine the effect sizes, and the analysis results revealed that the risk of CVD incidence in low and middle groups was 28% and 7% higher than that in the high group, respectively [HR = 1.28, 95%CI (1.16, 1.41); HR = 1.07, 95%CI (1.03, 1.11)]. Meanwhile, the risk of CVD mortality in low and middle groups was 19% and 10% higher than that in the high group, respectively [HR = 1.19, 95%CI (1.11, 1.29); HR = 1.10, 95%CI (1.02, 1.17)]. The effects of deprivation on CVD incidence and mortality are shown in Fig. 4.
Fig. 4.
(a) Effects of deprivation on CVD incidence (b) Effects of deprivation on CVD mortality
Subgroup analysis
We conducted subgroup analyses on gender and national income levels to explore more details. The detailed information is presented in Online Resource 3.
Male/female income and CVD outcomes
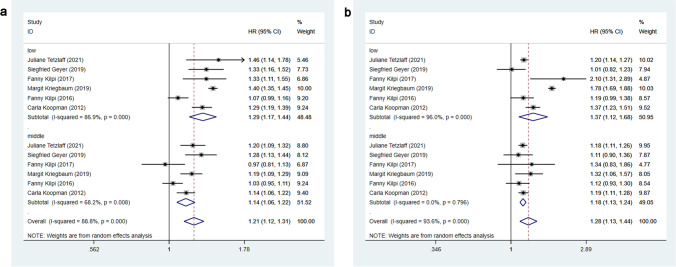
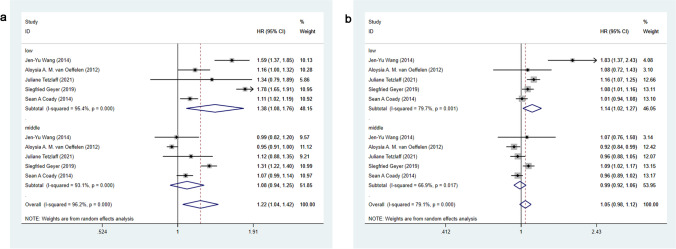
Nine studies (Koopman et al. 2012; van Oeffelen et al. 2012; Coady et al. 2014; Wang et al. 2014; Kilpi et al. 2016, 2017; Geyer et al. 2019; Kriegbaum et al. 2019; Tetzlaff et al. 2021) evaluated the relationship between male/female income and CVD outcomes. A random-effects model (I2 = 88.8%, P = 0.000; I2 = 93.6%, P = 0.000; I2 = 96.2%, P = 0.000; I2 = 79.1%, P = 0.000) was adopted to combine the effect sizes, and the analysis results revealed that the risk of CVD incidence in low- and middle-income men was 29% and 14% higher than that in high-income men, respectively [HR = 1.29, 95%CI (1.17, 1.44); HR = 1.14, 95%CI (1.06, 1.22)]. The risk of CVD incidence in low- and middle-income women was 37% and 18% higher than that in high-income women, respectively [HR = 1.37, 95%CI (1.12, 1.68); HR = 1.18, 95%CI (1.13, 1.24)]. In addition, the risk of CVD mortality in low-income men was 38% higher than that in high-income men [HR = 1.38, 95%CI (1.08, 1.76)]. The risk of CVD mortality in low-income women was 14% higher than that in high-income women [HR = 1.14, 95%CI (1.02, 1.27)]. The difference was not statistically significant in the risk of CVD mortality between middle- and high-income men/women, as shown in Figs. 5 and 6.
Fig. 5.
(a) Effects of male income on CVD incidence (b) Effects of female income on CVD incidence
Fig. 6.
(a) Effects of male income on CVD mortality (b) Effects of female income on CVD mortality
LMICs/HICs income and CVD outcomes
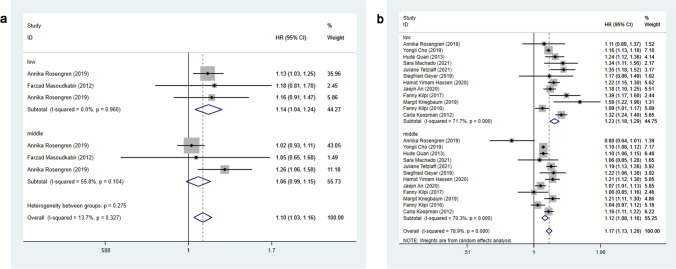
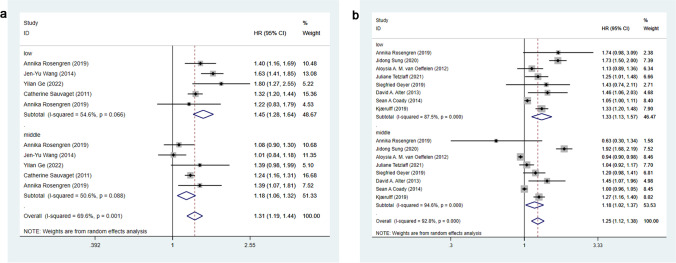
Twenty-one studies (Sauvaget et al. 2011; Koopman et al. 2012; Masoudkabir et al. 2012; van Oeffelen et al. 2012; Alter et al. 2013; Quan et al. 2013; Coady et al. 2014; Wang et al. 2014; Kilpi et al. 2016, 2017; Cho et al. 2019; Geyer et al. 2019; An et al. 2020) evaluated the association between income and CVD outcomes among LMICs/HICs. A fixed-effects model (I2 = 13.7%, P = 0.327) and a random-effects model (I2 = 78.9%, P = 0.000; I2 = 69.6%, P = 0.001; I2 = 92.8%, P = 0.000) were adopted to merge the effect sizes, and the results revealed that the risk of CVD incidence was 14% higher in the low-income group than in the high-income group among LMICs [HR = 1.14, 95%CI (1.04, 1.24)]. The risk of CVD incidence was 23% and 12% higher in low- and middle-income groups than in the high-income group among HICs, respectively [HR = 1.23, 95%CI (1.18, 1.29); HR = 1.12, 95%CI (1.08, 1.16)]. In addition, the risk of CVD mortality was 45% and 18% higher in low- and middle-income groups than in the high-income group among LMICs, respectively [HR = 1.45, 95%CI (1.28, 1.64); HR = 1.18, 95%CI (1.06, 1.32)]. The risk of CVD mortality was 33% and 18% higher in low- and middle-income groups than in high-income group among HICs, respectively [HR = 1.33, 95%CI (1.13, 1.57); HR = 1.18, 95%CI (1.02, 1.37)]. There was no significant difference in the risk of CVD incidence between the middle- and high-income groups among LMICs. The effects of income on CVD incidence among LMICs/HICs are shown in Fig. 7, and the effects of income on CVD mortality among LMICs/HICs are shown in Fig. 8.
Fig. 7.
(a) Effects of income on CVD incidence among LMICs (b) Effects of income on CVD incidence among HICs
Fig. 8.
(a) Effects of income on CVD mortality among LMICs (b) Effects of income on CVD mortality among HICs
Male/female education and CVD outcomes
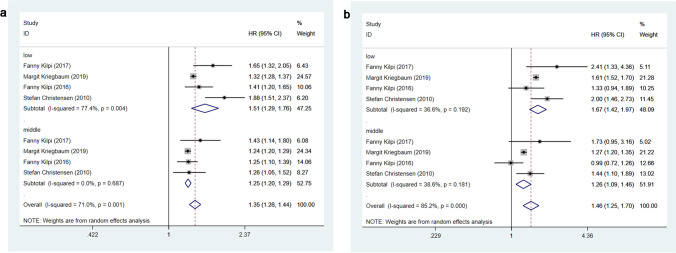
Four studies (Christensen et al. 2011; Kilpi et al. 2016, 2017; Kriegbaum et al. 2019) evaluated the relationship between male/female education and CVD incidence. Due to a lack of relevant literature, it was impossible to analyze the relationship between male/female education and CVD mortality. A random-effects model (I2 = 71.0%, P = 0.001; I2 = 85.2%, P = 0.000) was adopted to merge the effect sizes, and the analysis results revealed that the risk of CVD incidence in low- and middle-education men was 51% and 25% higher than that in high-education men, respectively [HR = 1.51, 95%CI (1.29, 1.76); HR = 1.25, 95%CI (1.20, 1.29)]. The risk of CVD incidence in low- and middle-education women was 67% and 26% higher than that in high-education women, respectively [HR = 1.67, 95%CI (1.42, 1.97); HR = 1.26, 95%CI (1.09, 1.46)]. The effects of male/female education on CVD incidence are shown in Fig. 9.
Fig. 9.
(a) Effects of male education on CVD incidence (b) Effects of female education on CVD incidence
LMICs/HICs education and CVD outcomes
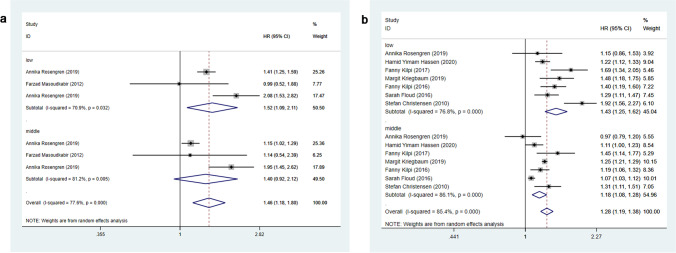
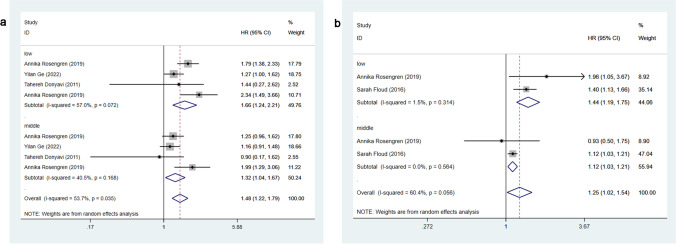
Ten studies (Christensen et al. 2011; Donyavi et al. 2011; Masoudkabir et al. 2012; Floud et al. 2016; Kilpi et al. 2016, 2017; Kriegbaum et al. 2019; Rosengren et al. 2019; Hassen et al. 2020; Ge et al. 2022) evaluated the association between education and CVD outcomes among LMICs/HICs. A random-effects model (I2 = 77.6%, P = 0.000; I2 = 85.4%, P = 0.000; I2 = 53.7%, P= 0.035; I2 = 60.4%, P = 0.056) was adopted to merge the effect sizes, and the analysis revealed that the risk of CVD incidence was 52% higher in the low-education group than that in the high-education group among LMICs [HR = 1.52, 95%CI (1.09, 2.11)]. The risk of CVD incidence was 43% and 18% higher in low- and middle-education groups than in the high-education group among HICs, respectively [HR = 1.43, 95%CI (1.25, 1.62); HR = 1.18, 95%CI (1.08, 1.28)]. In addition, the risk of CVD mortality was 66% and 32% higher in low- and middle-education groups than in the high-education group among LMICs, respectively [HR = 1.66, 95%CI (1.24, 2.21); HR = 1.32, 95%CI (1.04, 1.67)]. The risk of CVD mortality was 44% and 12% higher in low- and middle-education groups than in the high-education group among HICs, respectively [HR = 1.44, 95%CI (1.19, 1.75); HR = 1.12, 95%CI (1.03, 1.21)]. There was no significant difference in the risk of CVD incidence between the middle and high-education groups in middle-income countries. The effects of education on CVD incidence among LMICs/HICs are shown in Fig. 10, and the effects of education on CVD mortality among LMICs/HICs are shown in Fig. 11.
Fig. 10.
(a) Effects of education on CVD incidence among LMICs (b) Effects of education on CVD incidence among HICs
Fig. 11.
(a) Effects of education on CVD mortality among LMICs (b) Effects of education on CVD mortality among HICs
Publication bias and sensitivity analysis
Based on the SES indicators of the included studies, the publication bias was analyzed using funnel plots and Egger’s tests. The value of P > 0.05 was considered to have no publication bias. Egger’s tests revealed that the P values of “Income of CVD Mortality” and “Income in HICs of CVD Mortality” were 0.003 and 0.017, respectively (as shown in Online Resource 4). Thus, the presence of publication bias among studies was considered. The indicators of publication bias in both groups were further analyzed using the trim-and-fill method (shown in Online Resource 5). After adding ten studies to the model, the funnel plot was symmetric, and the combined effect size of the “Income of CVD mortality” group was 1.08, 95%CI (0.99, 1.18). Similarly, after the addition of six studies, the combined effect size of the “Income in HICs of CVD mortality” group was 1.07, 95%CI (0.96, 1.19). Sensitivity analyses were performed by excluding each study individually from the meta-analysis to rule out the overrepresentation of individual study results in the meta-analysis. Sensitivity analyses revealed that the results of the meta-analysis were stable and reliable.
Discussion
The present study indicated that the incidence and mortality of CVD were higher in the lower SES population as compared to the higher SES population, that is, SES was inversely associated with CVD outcomes. This is due to the high prevalence of CVRFs such as smoking, alcohol consumption, hypertension, physical inactivity, obesity, diabetes, an unhealthy diet, and depression in low-SES groups, as well as the likelihood of delayed or lack of CVD care and treatment, which is consistent with previous studies (Khaing et al. 2017; Backholer et al. 2017). Gerber et al. (2010) have also noted that groups with higher SES give more priority to health and health-related behaviors (e.g., smoking cessation, a healthy diet, and physical activity) and maintain closer social ties (e.g., social cohesion and support), which may minimize CVD risk. Groups with lower SES may endure additional pressures of anxiety and stress (e.g., crime and unemployment), which may further exacerbate CVD risk.
Additionally, higher education and income are associated with higher acceptance and compliance with CVD treatment, and higher availability and affordability of CVD management and care. Patients with higher education and income tend to have easier access to and accept more timely treatment and care services, thereby reducing the risk of CVD (Gerber et al. 2011; Rabi et al. 2010; Abdalla et al. 2020; Pietrzykowski et al. 2020; Bandi et al. 2017; Alter et al. 1999). Differing from income and education, deprivation affects CVD mainly through CVRFs. The more severe the deprivation is, the higher the CVRFs prevalence is, which may indirectly affect CVD incidence (Pujades-Rodriguez et al. 2014; Foster et al. 2018).
We conducted a subgroup analysis by gender. In addition to the previously addressed results that SES was negatively correlated with CVD outcomes, we also discovered that women tend to be more sensitive to income and education in terms of CVD incidence. This may be attributed to lower risk awareness in women with less typical clinical symptoms, who are less likely to receive preventive CVD treatment (Mehta et al. 2016; Grintsova et al. 2014; Giles et al. 1993). CVD mortality is the opposite, and men tend to be more sensitive to income and education, possibly because they are more likely to develop comorbidities and have a delay in seeking medical care (Miettinen et al. 1998; Salomaa et al. 2001), resulting in exacerbation of the disease.
We also conducted a subgroup analysis by national income levels, and the negative correlation between SES and CVD outcomes was also found in both LMICs and HICs. Moreover, in terms of CVD mortality, the LMIC population tends to be more sensitive to income and education. This may be attributed to differences between LMICs and HICs in terms of medical services, access to and affordability of medicines, and thresholds for diagnosis and treatment (Yusuf et al. 2014). Furthermore, HICs are more successful in risk identification and disease control (Pujades-Rodriguez et al. 2014; Neuhauser et al. 2015), whereas LMICs do poorly in risk identification and disease prevention (Ikeda et al. 2014; Farzadfar et al. 2011), which may be another cause for the described trend.
In addition, some studies have indicated a positive correlation between SES and CVD outcomes in LMICs (Stringhini and Bovet 2017; Terris 1999; Chadha et al. 1990), which seems inconsistent with our research. However, this difference is explicable, which may be because the LMICs included in our study are experiencing a transition from a positive correlation to a negative correlation between SES and CVD (Clark et al. 2009). In the early stage of economic development, people with high SES may have a higher risk of CVD. While in the later stage, low SES can be associated with a higher risk of CVD (Liu et al. 2013; Chaix et al. 2007; Kapral et al. 2012; Yusuf et al. 2001), that is, the relationship between SES and CVD in LMICs may eventually be negatively correlated with HICs.
The current study performed a comprehensive analysis of the association between gender, national income levels, SES, and CVD, and it also investigated the interrelationship between SES and CVD with more detailed findings, which are considered one of the highlights of this research. To our knowledge, this is the first meta-analysis to systematically assess the association between SES and CVD outcomes based on different national income levels in different countries. Additionally, to improve the comparability and explore the effect of the risk gradient among various studies, we categorized SES into low, medium, and high levels, and further findings were uncovered in terms of gender (Backholer et al. 2017).
This study also has some limitations. First, the pooled results presented certain heterogeneity, which may be due to the differences in the characteristics of the research population, the definition and classification of SES, and the actual development of HICs and LMICs. Some original data was not available to us, and several studies did not adjust for or report confounding variables. Despite many efforts that have been made to explore heterogeneity, we failed to identify the source of heterogeneity. Second, there are few studies on LMICs after 2010, most of which are from middle-income countries with rapid economic development, including China and India. The interrelationship between SES and CVD in such countries indicates a reverse relationship similar to that of HICs, which is also the reason why our research results are inconsistent with previous results among LMICs. Subsequently, more studies are recommended to focus on LMICs with poor economic conditions.
Conclusions
SES is inversely correlated with CVD outcomes and the prevalence of CVRFs. As for CVD incidence, women tend to be more sensitive to income and education. In terms of CVD mortality, men tend to be more sensitive to income and education, and people from LMICs are sensitive to income and education. Due to the small amount of relevant literature, future research is recommended to highlight the subgroup analysis of gender and LMICs.
Supplementary information
Search strategy (PDF 122 kb)
Quality assessment of the included studies using the NIH-QAT (PDF 122 kb)
The results of meta-analysis (PDF 124 kb)
Egger’s test results of publication bias (PDF 98 kb)
Results of trim-and-fill method (PDF 89 kb)
Authors’ contributions
All authors contributed to the study conception and design. Material preparation, data collection and analysis were performed by Tao Wang and Xiaoqiang Zheng. The first draft of the manuscript was written by Tao Wang and Yilin Li. All authors commented on previous versions of the manuscript. All authors read and approved the final manuscript.
Funding
This work was supported by the Social Science Foundation of Southwest Petroleum University.
Data availability
The data used to support the findings of this study are included within the article.
Code availability
Not applicable.
Declarations
Ethical statement
Not applicable
Ethics approval
Not applicable
Consent to participate
Not applicable
Consent for publication
Not applicable.
Conflicts of interest
The authors declare no competing interests.
Footnotes
Publisher’s note
Springer Nature remains neutral with regard to jurisdictional claims in published maps and institutional affiliations.
References
- Abdalla SM, Yu S, Galea S. Trends in cardiovascular disease prevalence by income level in the United States. JAMA Netw Open. 2020;3:e2018150. doi: 10.1001/jamanetworkopen.2020.18150. [DOI] [PMC free article] [PubMed] [Google Scholar]
- Alter DA, Naylor CD, Austin P, et al. Effects of socioeconomic status on access to invasive cardiac procedures and on mortality after acute myocardial infarction. N Engl J Med. 1999;341:1359–1367. doi: 10.1056/nejm199910283411806. [DOI] [PubMed] [Google Scholar]
- Alter DA, Franklin B, Ko DT, Austin PC, Lee DS, Oh PI, Stukel TA, Tu JV (2013) Socioeconomic status, functional recovery, and long-term mortality among patients surviving acute myocardial infarction. PLoS One 8(6):e65130. 10.1371/journal.pone.0065130 [DOI] [PMC free article] [PubMed]
- An J, Zhang Y, Muntner P, et al. Recurrent atherosclerotic cardiovascular event rates differ among patients meeting the very high risk definition according to age, sex, race/ethnicity, and socioeconomic status. J Am Heart Assoc. 2020;9:e017310. doi: 10.1161/jaha.120.017310. [DOI] [PMC free article] [PubMed] [Google Scholar]
- Backholer K, Peters SAE, Bots SH, et al. Sex differences in the relationship between socioeconomic status and cardiovascular disease: a systematic review and meta-analysis. J Epidemiol Commun Health. 2017;71:550–557. doi: 10.1136/jech-2016-207890. [DOI] [PubMed] [Google Scholar]
- Bandi P, Goldmann E, Parikh NS, et al. Age-related differences in antihypertensive medication adherence in Hispanics: a cross-sectional community-based survey in New York City, 2011-2012. Prev Chronic Dis. 2017;14:E57. doi: 10.5888/pcd14.160512. [DOI] [PMC free article] [PubMed] [Google Scholar]
- Blais C, Hamel D, Rinfret S. Impact of socioeconomic deprivation and area of residence on access to coronary revascularization and mortality after a first acute myocardial infarction in Québec. Can J Cardiol. 2012;28:169–177. doi: 10.1016/j.cjca.2011.10.009. [DOI] [PubMed] [Google Scholar]
- Chadha SL, Radhakrishnan S, Ramachandran K, et al. Epidemiological study of coronary heart disease in urban population of Delhi. Indian J Med Res. 1990;92:424–430. [PubMed] [Google Scholar]
- Chaix B, Rosvall M, Merlo J. Assessment of the magnitude of geographical variations and socioeconomic contextual effects on ischaemic heart disease mortality: a multilevel survival analysis of a large Swedish cohort. J Epidemiol Community Health. 2007;61:349–355. doi: 10.1136/jech.2006.047597. [DOI] [PMC free article] [PubMed] [Google Scholar]
- Cho Y, Lim TH, Kang H, et al. Socioeconomic status and depression as combined risk factors for acute myocardial infarction and stroke: A population-based study of 2.7 million Korean adults. J Psychosom Res. 2019;121:14–23. doi: 10.1016/j.jpsychores.2019.01.016. [DOI] [PubMed] [Google Scholar]
- Christensen S, Mogelvang R, Heitmann M, et al. Level of education and risk of heart failure: a prospective cohort study with echocardiography evaluation. Eur Heart J. 2011;32:450–458. doi: 10.1093/eurheartj/ehq435. [DOI] [PubMed] [Google Scholar]
- Clark AM, DesMeules M, Luo W, et al. Socioeconomic status and cardiovascular disease: risks and implications for care. Nat Rev Cardiol. 2009;6:712–722. doi: 10.1038/nrcardio.2009.163. [DOI] [PubMed] [Google Scholar]
- Coady SA, Johnson NJ, Hakes JK, et al. Individual education, area income, and mortality and recurrence of myocardial infarction in a Medicare cohort: the National Longitudinal Mortality Study. BMC Public Health. 2014;14:705. doi: 10.1186/1471-2458-14-705. [DOI] [PMC free article] [PubMed] [Google Scholar]
- Colantonio LD, Richman JS, Carson AP et al (2017) Performance of the atherosclerotic cardiovascular disease pooled vohort risk equations by social deprivation status. J Am Heart Assoc 6. 10.1161/jaha.117.005676 [DOI] [PMC free article] [PubMed]
- Deguen S, Lalloue B, Bard D, et al. A small-area ecologic study of myocardial infarction, neighborhood deprivation, and sex: a Bayesian modeling approach. Epidemiology. 2010;21:459–466. doi: 10.1097/EDE.0b013e3181e09925. [DOI] [PubMed] [Google Scholar]
- Donyavi T, Naieni KH, Nedjat S, et al. Socioeconomic status and mortality after acute myocardial infarction: a study from Iran. Int J Equity Health. 2011;10:9. doi: 10.1186/1475-9276-10-9. [DOI] [PMC free article] [PubMed] [Google Scholar]
- Farzadfar F, Finucane MM, Danaei G, et al. National, regional, and global trends in serum total cholesterol since 1980: systematic analysis of health examination surveys and epidemiological studies with 321 country-years and 3·0 million participants. Lancet. 2011;377:578–586. doi: 10.1016/s0140-6736(10)62038-7. [DOI] [PubMed] [Google Scholar]
- Floud S, Balkwill A, Moser K, et al. The role of health-related behavioural factors in accounting for inequalities in coronary heart disease risk by education and area deprivation: prospective study of 1.2 million UK women. BMC Med. 2016;14:145. doi: 10.1186/s12916-016-0687-2. [DOI] [PMC free article] [PubMed] [Google Scholar]
- Foster HME, Celis-Morales CA, Nicholl BI, et al. The effect of socioeconomic deprivation on the association between an extended measurement of unhealthy lifestyle factors and health outcomes: a prospective analysis of the UK Biobank cohort. Lancet Public Health. 2018;3:e576–e585. doi: 10.1016/s2468-2667(18)30200-7. [DOI] [PubMed] [Google Scholar]
- Ge Y, Zhang L, Gao Y, et al. Socio-economic status and 1 year mortality among patients hospitalized for heart failure in China. ESC Heart Fail. 2022;9:1027–1037. doi: 10.1002/ehf2.13762. [DOI] [PMC free article] [PubMed] [Google Scholar]
- Gerber Y, Benyamini Y, Goldbourt U, et al. Neighborhood socioeconomic context and long-term survival after myocardial infarction. Circulation. 2010;121:375–383. doi: 10.1161/circulationaha.109.882555. [DOI] [PubMed] [Google Scholar]
- Gerber Y, Koton S, Goldbourt U, et al. Poor neighborhood socioeconomic status and risk of ischemic stroke after myocardial infarction. Epidemiology. 2011;22:162–169. doi: 10.1097/EDE.0b013e31820463a3. [DOI] [PubMed] [Google Scholar]
- Geyer S, Tetzlaff J, Eberhard S, et al. Health inequalities in terms of myocardial infarction and all-cause mortality: a study with German claims data covering 2006 to 2015. Int J Public Health. 2019;64:387–397. doi: 10.1007/s00038-019-01224-1. [DOI] [PubMed] [Google Scholar]
- Giles WH, Anda RF, Jones DH, et al. Recent trends in the identification and treatment of high blood cholesterol by physicians. Prog Missed Opportun Jama. 1993;269:1133–1138. [PubMed] [Google Scholar]
- Goswami SK, Ranjan P, Dutta RK, et al. Management of inflammation in cardiovascular diseases. Pharmacol Res. 2021;173:105912. doi: 10.1016/j.phrs.2021.105912. [DOI] [PMC free article] [PubMed] [Google Scholar]
- Grintsova O, Maier W, Mielck A. Inequalities in health care among patients with type 2 diabetes by individual socio-economic status (SES) and regional deprivation: a systematic literature review. Int J Equity Health. 2014;13:43. doi: 10.1186/1475-9276-13-43. [DOI] [PMC free article] [PubMed] [Google Scholar]
- Hamling J, Lee P, Weitkunat R, et al. Facilitating meta-analyses by deriving relative effect and precision estimates for alternative comparisons from a set of estimates presented by exposure level or disease category. Stat Med. 2008;27:954–970. doi: 10.1002/sim.3013. [DOI] [PubMed] [Google Scholar]
- Hassen HY, Bastiaens H, Van Royen K, et al. Socioeconomic and behavioral determinants of cardiovascular diseases among older adults in Belgium and France: a longitudinal analysis from the SHARE study. PLoS One. 2020;15:e0243422. doi: 10.1371/journal.pone.0243422. [DOI] [PMC free article] [PubMed] [Google Scholar]
- Havranek EP, Mujahid MS, Barr DA, et al. Social determinants of risk and outcomes for cardiovascular disease: a scientific statement from the American Heart Association. Circulation. 2015;132:873–898. doi: 10.1161/cir.0000000000000228. [DOI] [PubMed] [Google Scholar]
- Hippisley-Cox J, Coupland C, Vinogradova Y, et al. Predicting cardiovascular risk in England and Wales: prospective derivation and validation of QRISK2. Bmj. 2008;336:1475–1482. doi: 10.1136/bmj.39609.449676.25. [DOI] [PMC free article] [PubMed] [Google Scholar]
- Ikeda N, Sapienza D, Guerrero R, et al. Control of hypertension with medication: a comparative analysis of national surveys in 20 countries. Bull World Health Organ. 2014;92:10–19c. doi: 10.2471/blt.13.121954. [DOI] [PMC free article] [PubMed] [Google Scholar]
- Jin K, Neubeck L, Atherton I. Impact of area deprivation on the cardiac mortality in the UK between1991 and 2010: evidence from a population-based longitudinal study. Eur J Cardiovasc Nurs. 2021;20:436–444. doi: 10.1093/eurjcn/zvaa021. [DOI] [PubMed] [Google Scholar]
- Kaplan GA, Keil JE. Socioeconomic factors and cardiovascular disease: a review of the literature. Circulation. 1993;88:1973–1998. doi: 10.1161/01.cir.88.4.1973. [DOI] [PubMed] [Google Scholar]
- Kapral MK, Fang J, Chan C, et al. Neighborhood income and stroke care and outcomes. Neurology. 2012;79:1200–1207. doi: 10.1212/WNL.0b013e31826aac9b. [DOI] [PMC free article] [PubMed] [Google Scholar]
- Khaing W, Vallibhakara SA, Attia J, et al. Effects of education and income on cardiovascular outcomes: a systematic review and meta-analysis. Eur J Prev Cardiol. 2017;24:1032–1042. doi: 10.1177/2047487317705916. [DOI] [PubMed] [Google Scholar]
- Kilpi F, Silventoinen K, Konttinen H, et al. Disentangling the relative importance of different socioeconomic resources for myocardial infarction incidence and survival: a longitudinal study of over 300,000 Finnish adults. Eur J Pub Health. 2016;26:260–266. doi: 10.1093/eurpub/ckv202. [DOI] [PubMed] [Google Scholar]
- Kilpi F, Silventoinen K, Konttinen H, et al. Early-life and adult socioeconomic determinants of myocardial infarction incidence and fatality. Soc Sci Med. 2017;177:100–109. doi: 10.1016/j.socscimed.2017.01.055. [DOI] [PubMed] [Google Scholar]
- Kjærulff TM, Bihrmann K, Zhao J, et al. Acute myocardial infarction: Does survival depend on geographical location and social background? Eur J Prev Cardiol. 2019;26:1828–1839. doi: 10.1177/2047487319852680. [DOI] [PubMed] [Google Scholar]
- Koopman C, van Oeffelen AA, Bots ML, et al. Neighbourhood socioeconomic inequalities in incidence of acute myocardial infarction: a cohort study quantifying age- and gender-specific differences in relative and absolute terms. BMC Public Health. 2012;12:617. doi: 10.1186/1471-2458-12-617. [DOI] [PMC free article] [PubMed] [Google Scholar]
- Kriegbaum M, Hougaard C, Andersen I, et al. Life course analysis on income and incident AMI: a Danish register-based cohort study. J Epidemiol Community Health. 2019;73:810–816. doi: 10.1136/jech-2018-212043. [DOI] [PubMed] [Google Scholar]
- Liu L, Xue F, Ma J, et al. Social position and chronic conditions across the life span and risk of stroke: a life course epidemiological analysis of 22,847 American adults in ages over 50. Int J Stroke. 2013;8(Suppl A100):50–55. doi: 10.1111/j.1747-4949.2012.00927.x. [DOI] [PMC free article] [PubMed] [Google Scholar]
- Machado S, Sumarsono A, Vaduganathan M. Midlife wealth mobility and long-term cardiovascular health. JAMA Cardiol. 2021;6(10):1152–1160. doi: 10.1001/jamacardio.2021.2056. [DOI] [PMC free article] [PubMed] [Google Scholar]
- Machón M, Aldasoro E, Martínez-Camblor P, et al. Socioeconomic differences in incidence and relative survival after a first acute myocardial infarction in the Basque Country, Spain. Gac Sanit. 2012;26:16–23. doi: 10.1016/j.gaceta.2011.06.013. [DOI] [PubMed] [Google Scholar]
- Masoudkabir F, Toghianifar N, Talaie M, et al. Socioeconomic status and incident cardiovascular disease in a developing country: findings from the Isfahan cohort study (ICS) Int J Public Health. 2012;57:561–568. doi: 10.1007/s00038-012-0344-2. [DOI] [PubMed] [Google Scholar]
- Mehta LS, Beckie TM, DeVon HA, et al. Acute myocardial infarction in women: a scientific statement from the American Heart Association. Circulation. 2016;133:916–947. doi: 10.1161/cir.0000000000000351. [DOI] [PubMed] [Google Scholar]
- Miettinen H, Lehto S, Salomaa V, et al. Impact of diabetes on mortality after the first myocardial infarction. The FINMONICA Myocardial Infarction Register Study Group. Diabetes Care. 1998;21:69–75. doi: 10.2337/diacare.21.1.69. [DOI] [PubMed] [Google Scholar]
- Moher D, Liberati A, Tetzlaff J, et al. Preferred reporting items for systematic reviews and meta-analyses: the PRISMA statement. PLoS Med. 2009;6:e1000097. doi: 10.1371/journal.pmed.1000097. [DOI] [PMC free article] [PubMed] [Google Scholar]
- Neuhauser HK, Adler C, Rosario AS, et al. Hypertension prevalence, awareness, treatment and control in Germany 1998 and 2008-11. J Hum Hypertens. 2015;29:247–253. doi: 10.1038/jhh.2014.82. [DOI] [PubMed] [Google Scholar]
- Pietrzykowski Ł, Michalski P, Kosobucka A, et al. Medication adherence and its determinants in patients after myocardial infarction. Sci Rep. 2020;10:12028. doi: 10.1038/s41598-020-68915-1. [DOI] [PMC free article] [PubMed] [Google Scholar]
- Pujades-Rodriguez M, Timmis A, Stogiannis D, et al. Socioeconomic deprivation and the incidence of 12 cardiovascular diseases in 1.9 million women and men: implications for risk prediction and prevention. PLoS One. 2014;9:e104671. doi: 10.1371/journal.pone.0104671. [DOI] [PMC free article] [PubMed] [Google Scholar]
- Quan H, Chen G, Tu K, et al. Outcomes among 3.5 million newly diagnosed hypertensive Canadians. Can J Cardiol. 2013;29:592–597. doi: 10.1016/j.cjca.2012.12.016. [DOI] [PubMed] [Google Scholar]
- Rabi DM, Edwards AL, Svenson LW, et al. Association of median household income with burden of coronary artery disease among individuals with diabetes. Circ Cardiovasc Qual Outcomes. 2010;3:48–53. doi: 10.1161/circoutcomes.108.840611. [DOI] [PubMed] [Google Scholar]
- Rosengren A, Smyth A, Rangarajan S, et al. Socioeconomic status and risk of cardiovascular disease in 20 low-income, middle-income, and high-income countries: the Prospective Urban Rural Epidemiologic (PURE) study. Lancet Glob Health. 2019;7:e748–e760. doi: 10.1016/s2214-109x(19)30045-2. [DOI] [PubMed] [Google Scholar]
- Salomaa V, Miettinen H, Niemelä M, et al. Relation of socioeconomic position to the case fatality, prognosis and treatment of myocardial infarction events; the FINMONICA MI Register Study. J Epidemiol Community Health. 2001;55:475–482. doi: 10.1136/jech.55.7.475. [DOI] [PMC free article] [PubMed] [Google Scholar]
- Sauvaget C, Ramadas K, Fayette JM, et al. Socio-economic factors & longevity in a cohort of Kerala State, India. Indian J Med Res. 2011;133:479–486. [PMC free article] [PubMed] [Google Scholar]
- Schultz WM, Kelli HM, Lisko JC, et al. Socioeconomic Status and Cardiovascular Outcomes: Challenges and Interventions. Circulation. 2018;137:2166–2178. doi: 10.1161/circulationaha.117.029652. [DOI] [PMC free article] [PubMed] [Google Scholar]
- Stringhini S, Bovet P. Socioeconomic status and risk factors for non-communicable diseases in low-income and lower-middle-income countries. Lancet Glob Health. 2017;5:e230–e231. doi: 10.1016/s2214-109x(17)30054-2. [DOI] [PubMed] [Google Scholar]
- Sung J, Song YM, Hong KP. Relationship between the shift of socioeconomic status and cardiovascular mortality. Eur J Prev Cardiol. 2020;27(7):749–757. doi: 10.1177/2047487319856125. [DOI] [PubMed] [Google Scholar]
- Terris M. The development and prevention of cardiovascular disease risk factors: socioenvironmental influences. Prev Med. 1999;29:S11–S17. doi: 10.1006/pmed.1998.0476. [DOI] [PubMed] [Google Scholar]
- Tetzlaff J, Geyer S, Westhoff-Bleck M, et al. Social inequalities in mild and severe myocardial infarction: how large is the gap in health expectancies? BMC Public Health. 2021;21:259. doi: 10.1186/s12889-021-10236-7. [DOI] [PMC free article] [PubMed] [Google Scholar]
- Thorne K, Williams JG, Akbari A, et al. The impact of social deprivation on mortality following acute myocardial infarction, stroke or subarachnoid haemorrhage: a record linkage study. BMC Cardiovasc Disord. 2015;15:71. doi: 10.1186/s12872-015-0045-x. [DOI] [PMC free article] [PubMed] [Google Scholar]
- Timmis A, Vardas P, Townsend N, et al. European Society of Cardiology: cardiovascular disease statistics 2021. Eur Heart J. 2022;43:716–799. doi: 10.1093/eurheartj/ehab892. [DOI] [PubMed] [Google Scholar]
- Townsend N, Kazakiewicz D, Lucy Wright F, et al. Epidemiology of cardiovascular disease in Europe. Nat Rev Cardiol. 2022;19:133–143. doi: 10.1038/s41569-021-00607-3. [DOI] [PubMed] [Google Scholar]
- van Oeffelen AA, Agyemang C, Bots ML, et al. The relation between socioeconomic status and short-term mortality after acute myocardial infarction persists in the elderly: results from a nationwide study. Eur J Epidemiol. 2012;27:605–613. doi: 10.1007/s10654-012-9700-z. [DOI] [PMC free article] [PubMed] [Google Scholar]
- Wang JY, Wang CY, Juang SY, et al. Low socioeconomic status increases short-term mortality of acute myocardial infarction despite universal health coverage. Int J Cardiol. 2014;172:82–87. doi: 10.1016/j.ijcard.2013.12.082. [DOI] [PubMed] [Google Scholar]
- Woodward M, Brindle P, Tunstall-Pedoe H. Adding social deprivation and family history to cardiovascular risk assessment: the ASSIGN score from the Scottish Heart Health Extended Cohort (SHHEC) Heart. 2007;93:172–176. doi: 10.1136/hrt.2006.108167. [DOI] [PMC free article] [PubMed] [Google Scholar]
- Yusuf S, Reddy S, Ounpuu S, et al. Global burden of cardiovascular diseases: part I: general considerations, the epidemiologic transition, risk factors, and impact of urbanization. Circulation. 2001;104:2746–2753. doi: 10.1161/hc4601.099487. [DOI] [PubMed] [Google Scholar]
- Yusuf S, Rangarajan S, Teo K, et al. Cardiovascular risk and events in 17 low-, middle-, and high-income countries. N Engl J Med. 2014;371:818–827. doi: 10.1056/NEJMoa1311890. [DOI] [PubMed] [Google Scholar]
Associated Data
This section collects any data citations, data availability statements, or supplementary materials included in this article.
Supplementary Materials
Search strategy (PDF 122 kb)
Quality assessment of the included studies using the NIH-QAT (PDF 122 kb)
The results of meta-analysis (PDF 124 kb)
Egger’s test results of publication bias (PDF 98 kb)
Results of trim-and-fill method (PDF 89 kb)
Data Availability Statement
The data used to support the findings of this study are included within the article.
Not applicable.


