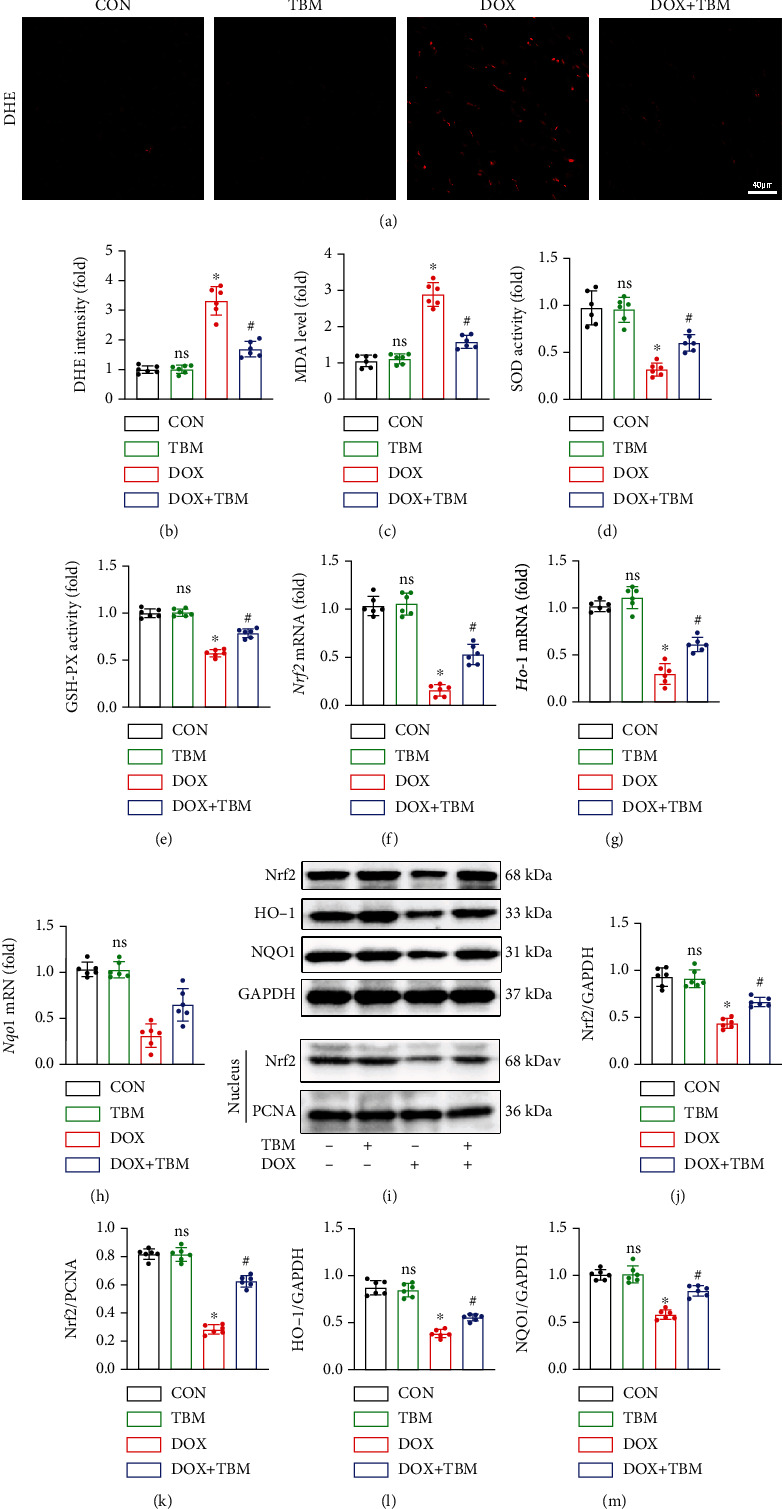
Figure 7.

TBM protected against DOX-induced oxidative stress in mice. (a, b) DHE staining indicated the generation of ROS in mice hearts (n = 6). (c) The MDA levels in mouse hearts (n = 6). (d, e) The activity of SOD and GSH-PX in mouse hearts (n = 6). (f–h) The mRNA levels of Nrf2, Ho-1, and Nqo1 in mice determined by qPCR (n = 6). (i–m) Western blotting analysis of Nrf2, HO-1, and NQO1 at the protein level (n = 6). Values indicate the mean ± SD. ∗P < 0.05 versus the CON group and the TBM group; #P < 0.05 versus the DOX group; ns (not significant) versus the CON group.
