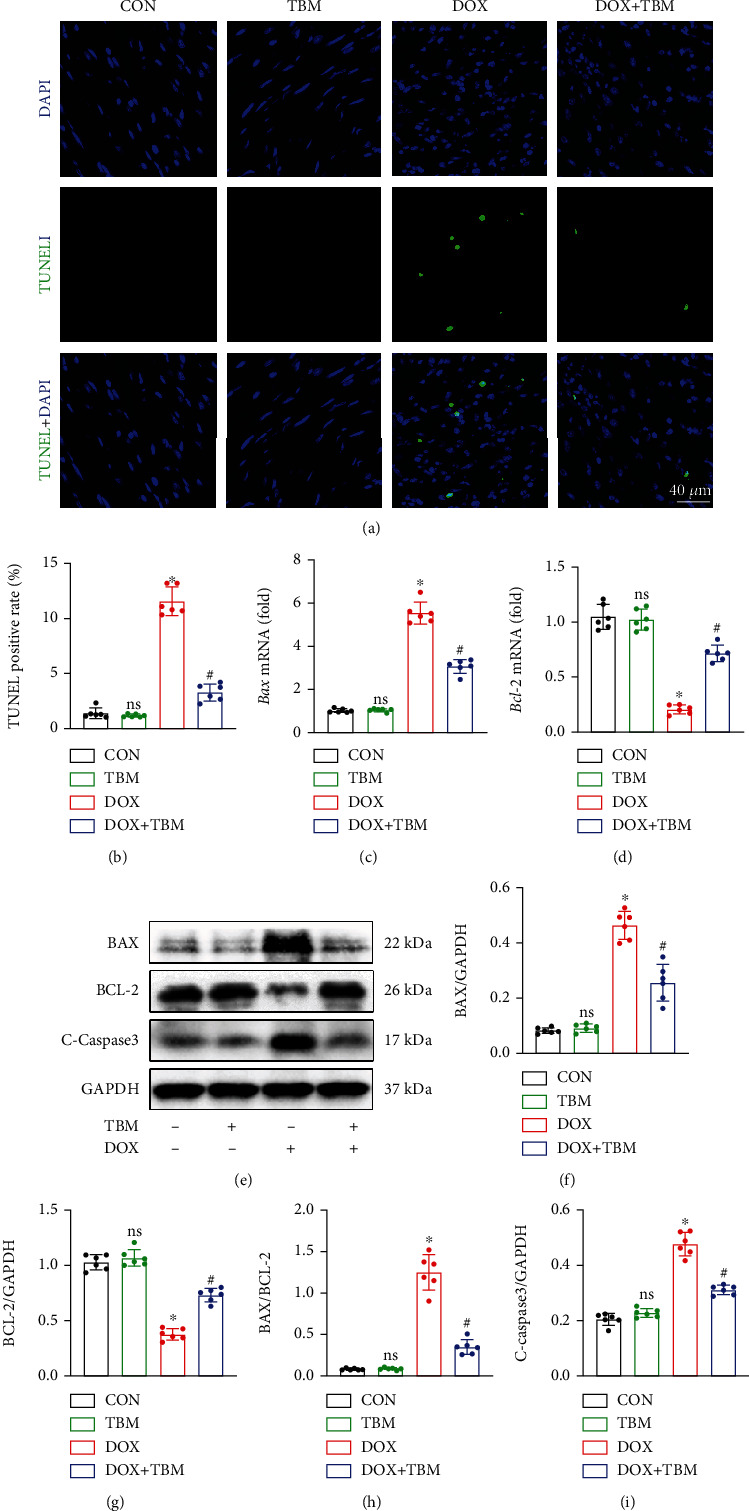
Figure 8.

TBM mitigated DOX-provoked cardiomyocyte apoptosis in vivo. (a, b) TUNEL staining represents cardiomyocyte apoptosis in the mouse hearts and its statistical result (n = 6). (c, d) The mRNA levels of Bax and Bcl-2 determined by qPCR analysis (n = 6). (e–i) Western blotting assays for the detection of BAX, BCL-2, and C-Caspase3 expression (n = 6). Values indicate the mean ± SD. ∗P < 0.05 versus the CON group and the TBM group; #P < 0.05 versus the DOX group; ns (not significant) versus the CON group.
