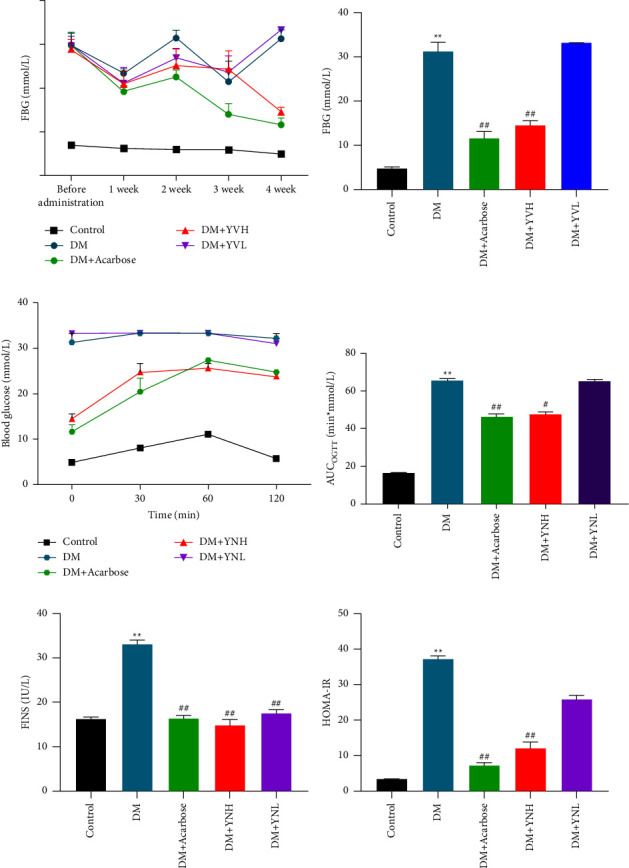
Figure 1.

The effect of Yunvjian on FBG, OGTT, and IR: (a) 4-week trend of FBG level; (b) 4th week FBG level; (c) OGTT; (d) AUCOGTT; (e) FINS; (f) HOMA-IR. Data are expressed as mean ± standard error. Compared with the control group: ∗∗P < 0.01; compared with the DM group: #P < 0.05 and ##P < 0.01.
