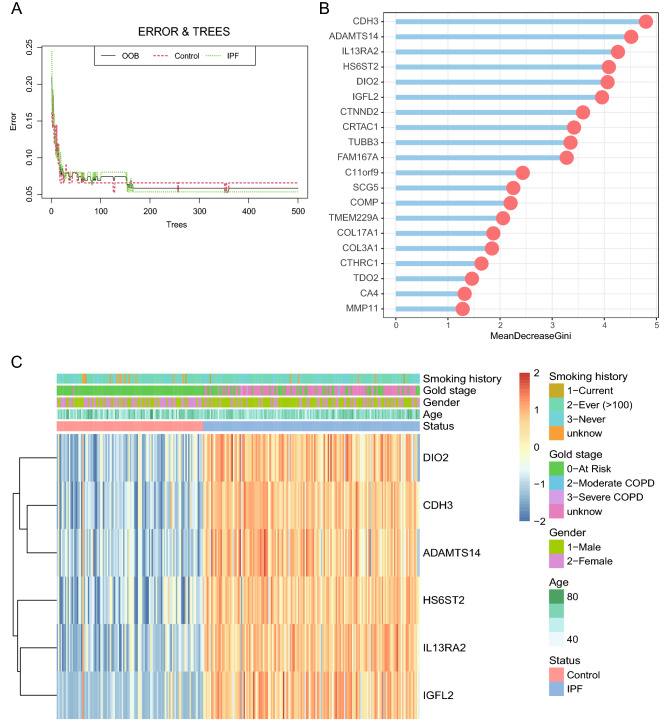
Figure 3.
Random Forest screening for DEGs. (A) The effect of the number of decision trees on the error rate. The x-axis represents the number of decision trees, and the y-axis represents the error rate. When the number of decision trees is about 500, the error rate is relatively stable. (B) Results of the Gini coefficient method in the random forest classifier. The x-axis represents the importance index, and the y-axis represents the genetic variables. Rank and display the top 20 genes of importance coefficient. (C) The unsupervised clustering heatmap shows the hierarchical clustering results generated from six significant genes generated by a random forest in GSE47460. On the upper part of the heatmap, the red band in the status module represents normal samples, and the blue band represents disease samples; the color in the age module gradually changes from white to green, representing the increasing age of the sample; the light green band in the gender module represents male samples, the purple strip represents female samples; the green strip in the gold stage module means AT Risk, the green strip means Moderate COPD; the purple strip means Severe COPD; the rose-red strip means unknown; the yellow strip in the smoking history module means the current still Smoking; green strips have ever smoked; blue strips have never smoked; orange strips are unknown.

