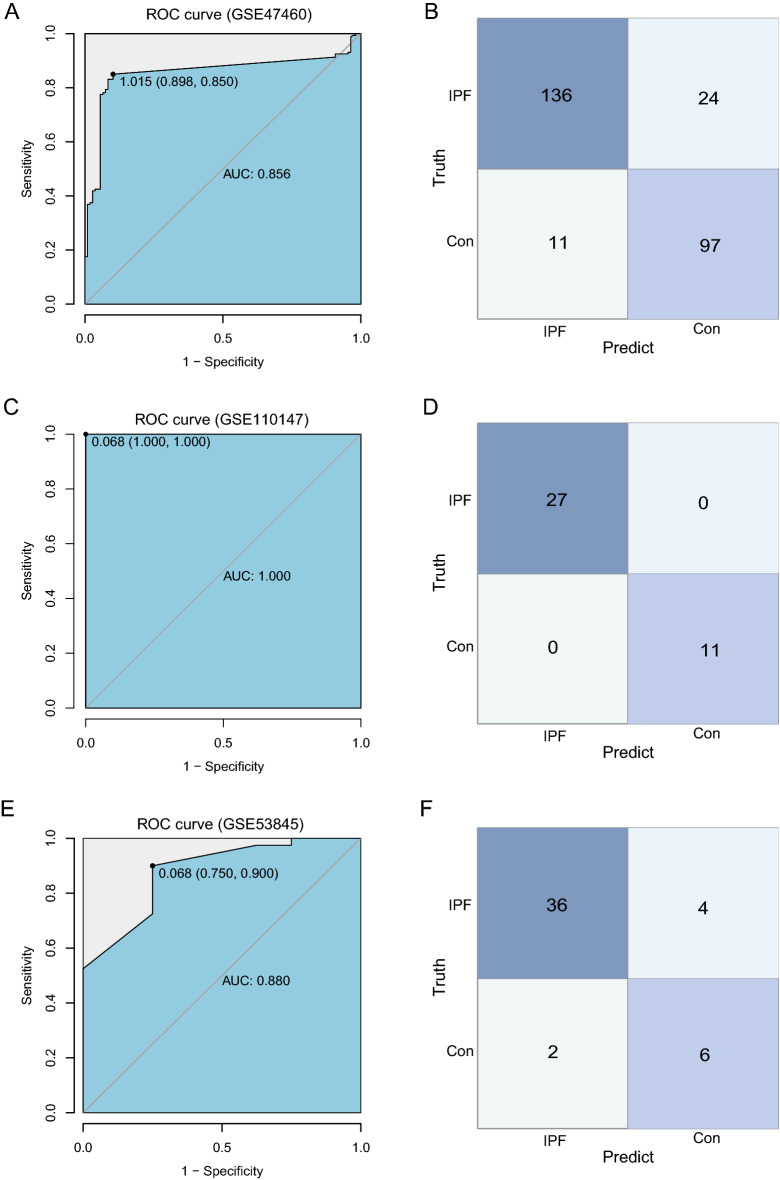
Figure 5.
Model accuracy verification. (A) Verification of the ROC curve results in GSE47460. The points marked on the ROC curve are the optimal threshold points, and the values in parentheses represent sensitivity and specificity. The AUC value is the area under the ROC curve. (B) GSE47460 confusion matrix result. The x-axis represents the predicted results, and the y-axis represents the actual results. (C) Verification of the ROC curve results in GSE110147. The points marked on the ROC curve are the optimal threshold points, and the values in parentheses represent sensitivity and specificity. The AUC value is the area under the ROC curve. (D) GSE110147 confusion matrix result. The x-axis represents the predicted results, and the y-axis represents the actual results. (E) Verification of the ROC curve results in GSE53845. The points marked on the ROC curve are the optimal threshold points, and the values in parentheses represent sensitivity and specificity. The AUC value is the area under the ROC curve. (F) GSE53845 confusion matrix result. The x-axis represents the predicted results, and the y-axis represents the actual results.

