Figure 3.
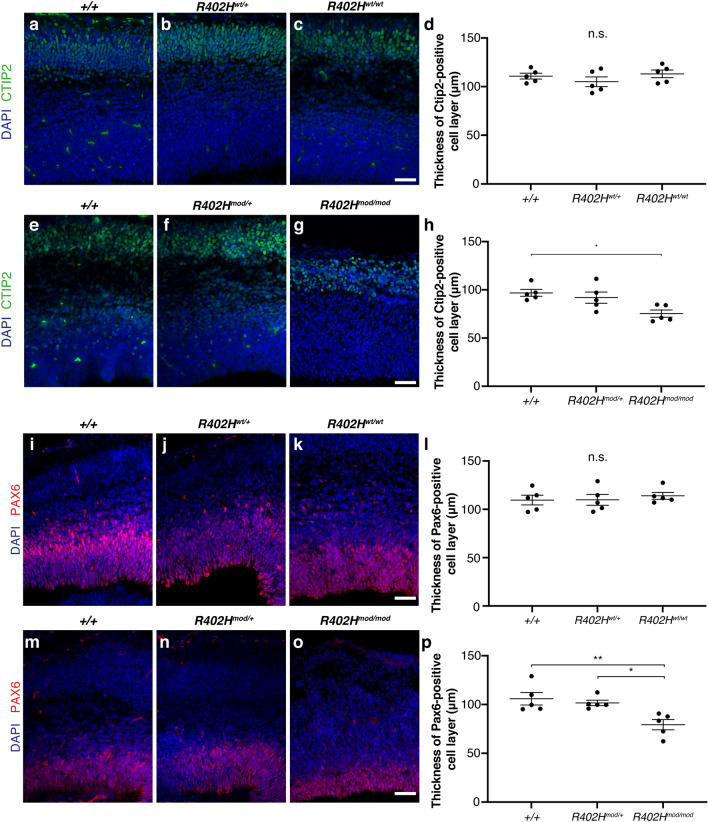
R402Hmod/R402Hmod embryos have a reduction in Ctip2 positive neurons and PAX6 positive progenitors. (a–c) Coronal sections of E16.5 embryos stained for the layer 5/6 neuronal marker Ctip2 from Tuba1a WT animals. (a) Wild-type (+/+); (b) heterozygous (R402Hwt/+), and (c) homozygous (R402Hwt/R402Hwt) animals are indistinguishable. (d) Quantification of Ctip2-positive neuronal layer reveals no significant different between homozygous animals and control littermates. (e–g) Representative coronal sections from Tuba1a modified embryos stained for Ctip2. (e) wild-type (+/+); (f) heterozygous (R402Hmod/+) and (g) homozygous (R402Hmod/R402Hmod) animals. (h) Quantification shows a significant reduction in Ctip2 layer thickness in homozygous R402Hmod/R402Hmod compared to wildtype littermates. Scale bars indicate 50 μm. (i–k) Representative coronal sections from E16.5 embryos stained for neural progenitor marker Pax6. (I) Wild-type (+ / +); (j) heterozygous (R402Hwt/+), and (k) homozygous (R402Hwt/R402Hwt) animals. (l) Quantification of ventricular zone thickness shows no significant different between homozygous animals and control littermates. (m–o) Coronal sections from Tuba1a modified embryos stained for Pax6. (m) wild-type (+/+); (n) heterozygous (R402Hmod/+) and (o) homozygous (R402Hmod/R402Hmod) animals. (p) Quantification shows a significant reduction in VZ thickness in homozygous R402Hmod/R402Hmod compared to wildtype littermates. One-way ANOVA with Tukey’s test for multiple comparisons. P* < 0.05, P** < 0.01. Error bars show Mean ± SEM. Scale bars indicate 50 μm.

