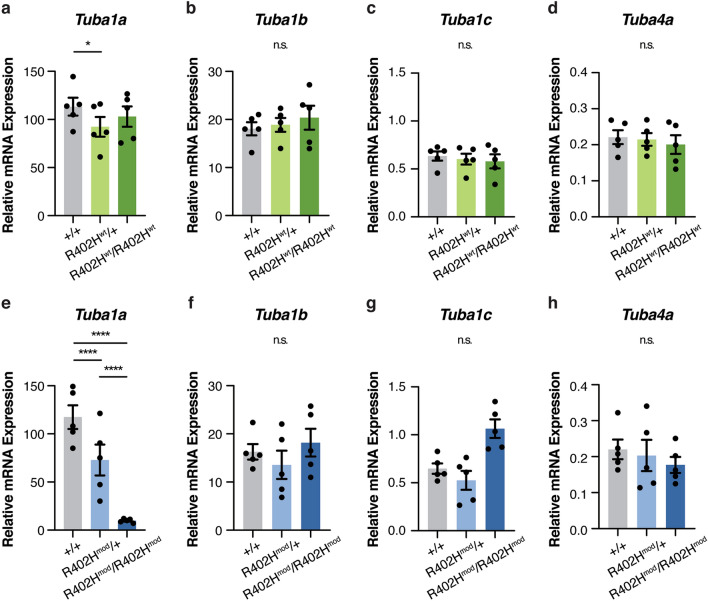
Figure 5.
Expression levels of mouse α-tubulin genes in the developing brain are perturbed in the R402H Tuba1a (modified) line. (a–d) mRNA expression levels of Tuba1a (a), Tuba1b (b), Tuba1c (c) and Tuba4a (d) were assessed by qPCR in E16.5 wild-type (grey), heterozygous (light green), and homozygous R402Hwt/R402Hwt (dark green) embryos. We found a slight reduction in the expression levels of Tuba1a levels between wild-type and heterozygous animals (n = 5, +/+ vs. R402Hwt/+ P < 0.05). (e–h) mRNA expression levels of Tuba1a (e), Tuba1b (f), Tuba1c (g) and Tuba4a (h) were assessed by qPCR in E16.5 wild-type (grey), heterozygous (light blue), and homozygous R402Hmod/R402Hmod (dark blue) embryos. There was a significant reduction in Tuba1a levels in both heterozygous and homozygous animals (n = 5, +/+ vs. R402Hmod/+ P < 0.0001; +/+ vs. R402Hmod/R402Hmod P < 0.0001 and R402Hmod/+ vs. R402Hmod/R402Hmod P < 0.0001). Error bars show mean ± s.e.m.. Two-way repeated measures ANOVA with Tukey’s test for multiple comparisons; n.s.—not significant; *P < 0.05; ****P < 0.0001.

