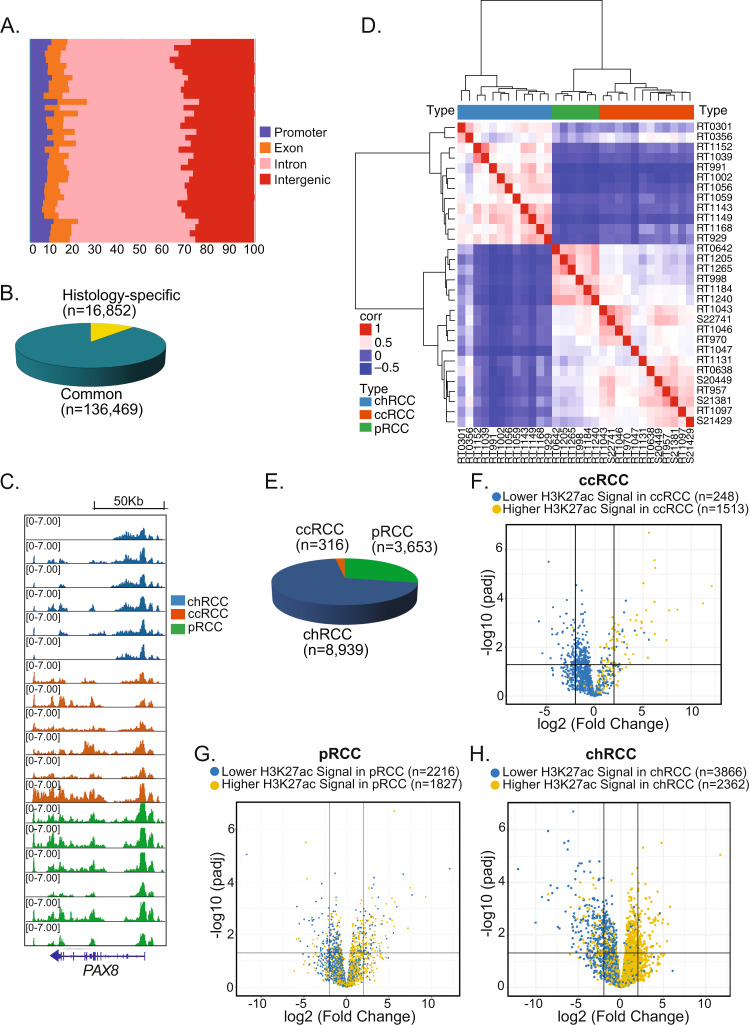
Fig. 1. Landscape of H3K27ac signals across RCC histologies.
A Distribution of RCC H3K27ac peaks according to genomic region for 30 fresh frozen RCC tumor samples (12 chRCC, 6 pRCC, 12 ccRCC). B Numbers of histology-specific and common H3K27ac peaks. C H3K27ac profiles at PAX8 in six representative samples from each RCC histology. D Hierarchical clustering of chRCC, ccRCC, and pRCC based on sample-to-sample pairwise correlation of the H3K27ac ChIP-seq peaks. E Distribution of histology-specific H3K27ac peaks among RCC subtypes. F–H Volcano plots with the log change of gene expression (FPKM) in one histology compared to the other two histologies (F ccRCC vs. others, G pRCC vs. others, H chRCC vs. others). Two-sided P values were used and corrected for multiple comparison testing (FDR-adjusted P value <0.05). RCC renal cell carcinoma, chRCC chromophobe RCC, ccRCC clear cell RCC, pRCC papillary RCC.

