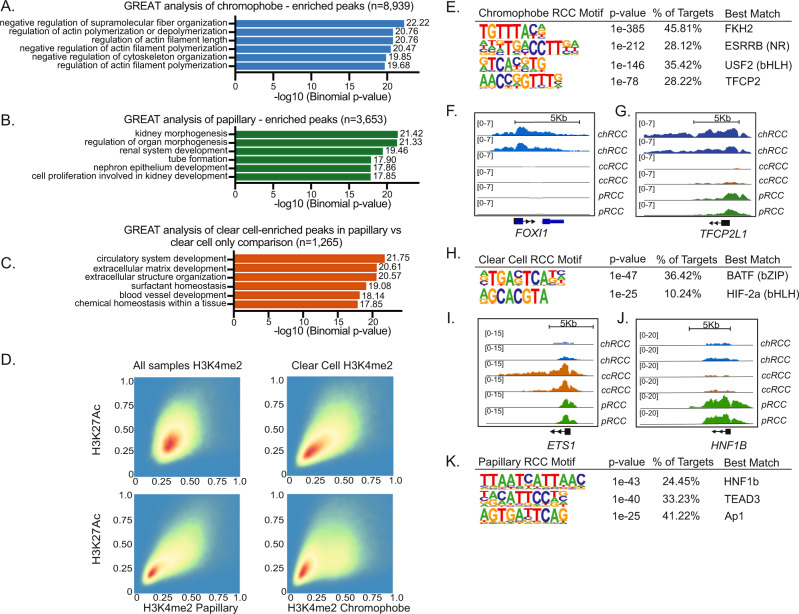
Fig. 2. Epigenetic annotation of regulatory elements identifies enrichment of histology-specific pathways and TFs.
A GREAT analysis of chromophobe-enriched peaks (n = 8939). Two-sided P values are shown. B GREAT analysis of papillary-enriched peaks (n = 3653). Two-sided P values are shown. C GREAT analysis of clear cell-enriched peaks in clear cell vs. papillary only comparison (n = 1265). A–C GREAT calculates statistical enrichments for association between genomic regions and annotations. Two-sided P values are shown. D Density map of correlation between H3K27ac versus H3K4me2 ChIP-seq peaks across subtypes. E Four most significantly enriched nucleotide motifs present in chRCC-specific sites by de novo motif analysis, limited by ATAC peaks. F, G H3K27ac profiles near FOXI1 and TFCP2L1, respectively, in two representative samples of each histology (chRCC, ccRCC, pRCC). H Two most significantly enriched nucleotide motifs present inccRCC specific sites by de novo motif analysis. P values are two-sided and unadjusted for multiple comparisons. I, J H3K27ac profiles near ETS-1, and HNF1B, respectively, in two representative samples of RCC histology. K Three most significantly enriched nucleotide motifs present in pRCC-specific sites by de novo motif analysis. P values are two-sided and unadjusted for multiple comparisons. RCC renal cell carcinoma, chRCC chromophobe RCC, ccRCC clear cell RCC, pRCC papillary RCC.

