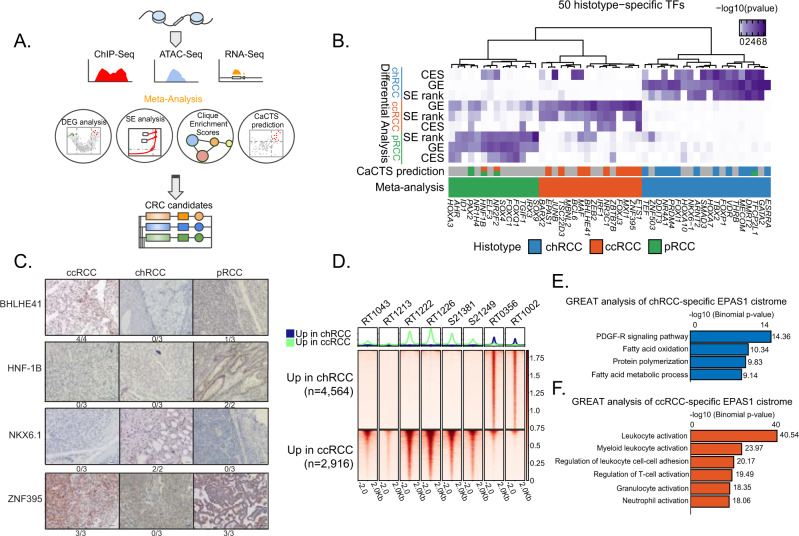
Fig. 3. Multi-dimensional integrative analysis identifies histology-specific master TFs.
A Overview of the approach used to nominate histology-specific master TFs participating in CRC. B Heatmap integrating the 50 histology-specific TFs identified by the meta-analysis approach (CES, differential expression, SE rank analysis, and CaCTS). C Representative immunohistochemical stainings of indicated antibodies in samples from ccRCC, chRCC, and pRCC tumors. Four histology-specific master TFs are shown. The number of positive tumors/number of tumors examined are indicated below each image (for ccRCC, n = 4 for TF BHLHE41, n = 3 for TFs HNF1B, NKX6.1, and ZNF395. For chRCC, n = 3 for TFs BHLHE41, HNF1B, and ZNF395, n = 2 for NKX6.1. For pRCC, n = 3 for BHLHE41, NKX6.1, and ZNF395, n = 2 for HNF1B). Scale bar is 50 μm. D ChIP-seq binding profiles of EPAS1 across 6 ccRCC and 2 chRCC human tissue samples. E GREAT analysis of chRCC- enriched EPAS1 peaks relative to ccRCC. Two-sided P values are shown. F GREAT analysis of ccRCC-enriched EPAS1 peaks relative to chRCC. Two-sided P values are shown. E, F GREAT calculates statistical enrichments for the association between genomic regions and annotations. ChIP-seq chromatin immunoprecipitation sequencing, ATAC-seq assay for transposase-accessible chromatin sequencing, DEG differentially expressed genes, SE superenhancer, CaCTS cancer core transcription-factor specificity, CRC core regulatory circuitries, RCC renal cell carcinoma, chRCC chromophobe RCC, ccRCC clear cell RCC, pRCC papillary RCC. Source data are provided as a Source Data file.

