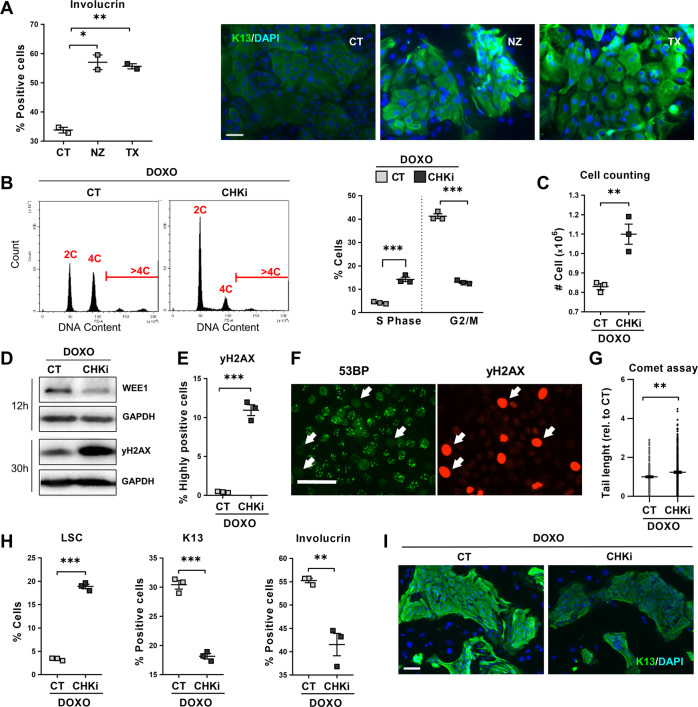
Fig. 6. The G2/M checkpoints drive squamous metaplasia in response to DNA damage.
A Human primary lung epithelial cells were treated with the dimethyl sulfoxide vehicle (CT), 20 μM Nocodazole (NZ, microtubule polimerisation inhibitor) or 200 μM Paclitaxel (TX, microtubule depolimerisation inhibitor). Left: Percent of CT, NZ, or TX involucrin positive cells, analysed by flow cytometry. Right: Immunofluorescence for involucrin (green). Blue is nuclear DNA by DAPI. Scale bar, 50 μm. B–I Human primary lung epithelial cells were treated with 0.07 μM Doxorubicin (DOXO) and with the dimethyl sulfoxide vehicle (CT) or with 0.5 μM AZD7762 (CHKi, Chk1/Chk2 inhibitor). B Representative flow-cytometry analyses of DNA content after the 24 h treatments as indicated. Plot on the right shows percent of CT or CHKi-treated cells in the S or G2/M phase of the cell cycle, as indicated. C Cell counting of recovered CT and CHKi-treated cells after 48 h treatment. D DNA damage marker γH2AX and Wee1 by Western blotting in cells treated for 12 or 30 h, as indicated. Glyceraldehyde 3-phosphate dehydrogenase (GAPDH) as loading control. E Percent of highly γH2AX positive cells, analysed by flow cytometry after 24 h. F Double immunofluorescence for 53BP (green) and γH2AX (red) in CHKi-treated cells at 24 h. Scale bar, 50 μm. White arrows point at strongly positive γH2AX cells lacking 53BP foci (typical of active DNA repair). G DNA fragmentation as analysed by comet assays after 24 h with the indicated treatments, measured by tail length relative to CT (n = 196–298). H Percent of low light scatter (LSC, left) cells, keratin K13 positive cells (centre) or involucrin positive cells (right), as analysed by flow cytometry (K13, 24 h-treatment; LSC and involucrin, 48 h-treatment). I Immunofluorescence of CT and CHKi-treated cells for keratin K13 (green) after 24 h treatments. Blue is nuclear DNA by DAPI. Scale bar, 100 μm. Positive cells by flow cytometry were gated according to negative isotype antibody control. Data are mean ± SEM of duplicate or triplicate samples, representative of 2–3 independent experiment from two different human individuals with similar results. ***p ≤ 0.001, **p ≤ 0.01, *p ≤ 0.05.

