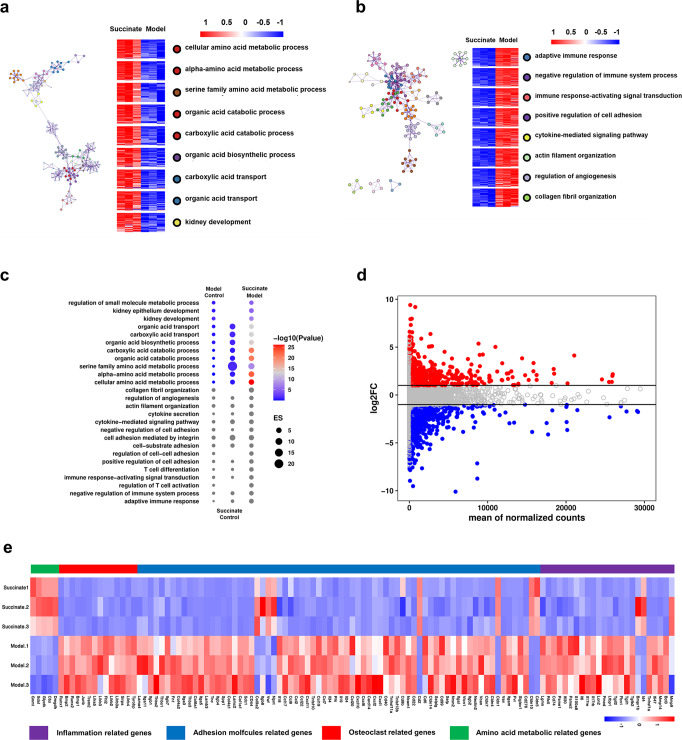
Fig. 6.
Reversal of EG-induced kidney damage by succinate as illustrated by RNA sequencing. a, b Gene ontology (GO) term enrichment analysis of the biological processes influenced by succinate and EG-treatment based on RNA-seq dataset. Up- (left) and downregulated processes (right) in the succinate treated group as compared with EG-treated model group. c Dot plot showing pairwise GSEA pathway comparison of the RNA-seq dataset of the succinate- and EG-treated model group and the corresponding controls. Blue and red dots respectively represented the down- and upregulated pathways. d A scatter plot showing expression fold change of DEGs between EG-treated model group and succinate group based on the RNA-seq dataset. e Heatmaps showing the expression of genes associated with inflammatory, apoptotic, and survival events in the rat kidney tissues from the EG-treated and succinate treated groups based on RNA-seq analysis. For (a–e), n = 3 rats in each group

