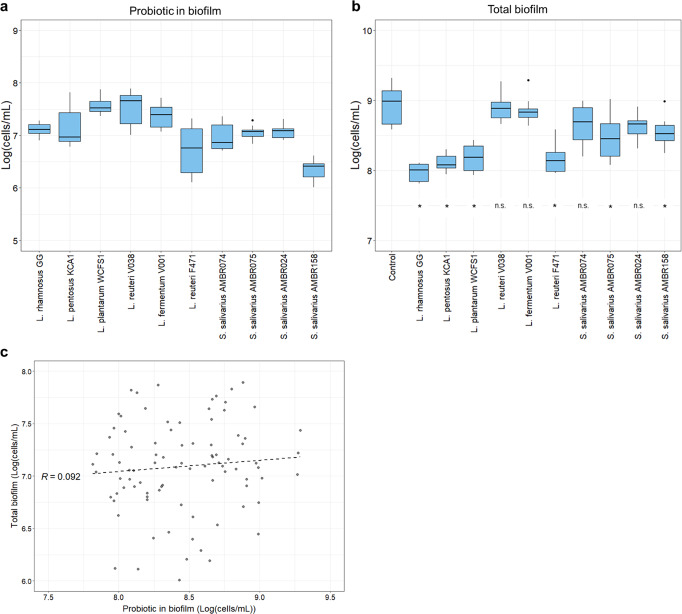
Fig. 2. Probiotic prevalence does not affect total biofilm counts.
Probiotic prevalence in biofilms (a), total cells in the biofilms (b) and both plotted against each other (c). Probiotic abundance and total biofilm are presented as a boxplot of the log10 cells per milliliter (log(cells/mL)) recovered from the discs of each probiotic per experiment (Tukey style boxplot with median centre line, IQR at 1.5, upper and lower hinges at 25th and 75th percentiles and whiskers at 1.5 IQR from the hinges). No correlation between the prevalence of the probiotic and the total biofilm was observed. Statistical differences in probiotic prevalence between conditions can be found in Supplementary Table 2. For the total biofilms, statistical differences from the control are depicted by an asterisk and otherwise as n.s. (n = 9; nonparametric Kruskal-Wallis with Dunn’s test).

