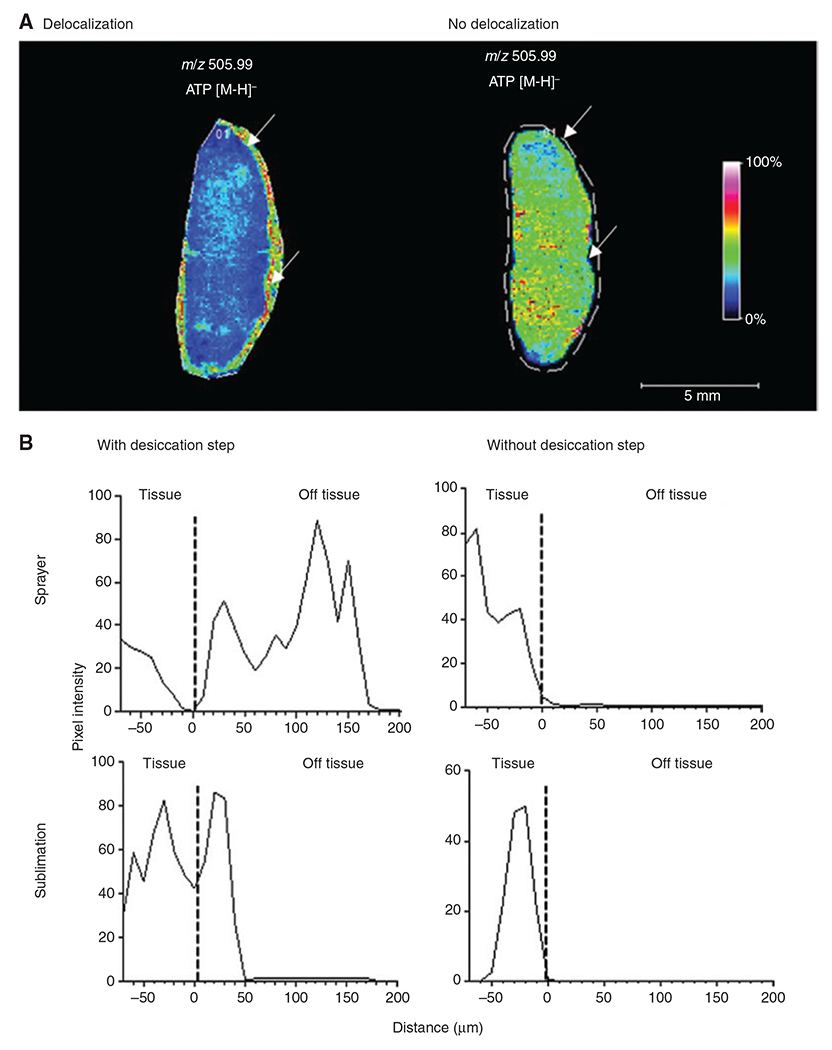
Figure 3:

Effect of sample handling and matrix deposition on analyte delocalisation.
(A) MS image of ATP (m/z 505.99) in a diffuse large B-cell lymphoma tissue showing ATP delocalization. On the left, a large portion of the detected ATP is localized outside the tissue due to delocalization, whereas on the right, ATP is contained within the tissue. The white line indicates the area that was sampled by MALDI-MSI, whereas the arrows point to the border of the tissue. NEDC matrix was applied to both tissues with the same spraying method. For the left tissue, nitrogen gas was used for the drying step, whereas the right tissue was dried in a carrier box with silica gel. (B) Reprinted with permission from Huizing et al. [52] to demonstrate that certain sample preparation steps, in particular the desiccation step, as well as means of matrix deposition, have an effect on the severity of analyte delocalization. Line profile of intensity distribution of m/z 808.5 ± 0.1 (identified as [PC(36:2) + Na+]). This graph shows that depending on the sample preparation, m/z 808.5 can be detected with high intensity up to 200 μm away from the border of the tissue, demonstrating a strong delocalization effect. Data shown were obtained using norharmane matrix. The dotted line indicates the edge of the tissue.
