
FIGURE 1.
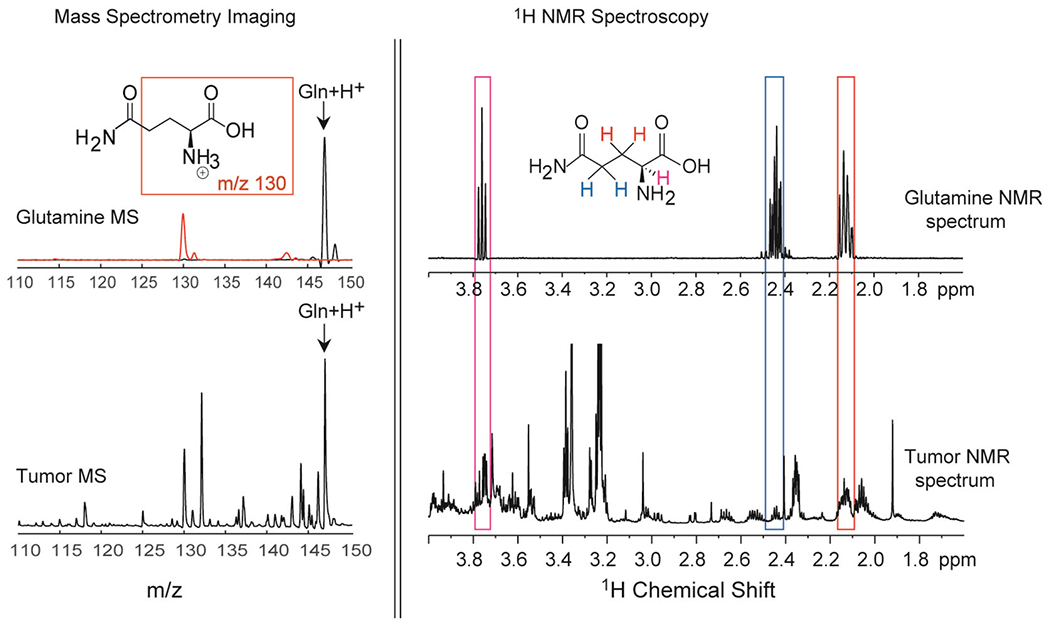
Representative spectra from MALDI imaging and 1H NMR spectroscopy of pure Gln, as well as Gln detected in MDA-MB-231 breast tumor xenografts. MALDI imaging (left) produced spectra based on the m/z of molecular ions, in this case [Gln + H+], which was confirmed using tandem MS (top left, red spectral line). Tandem MS detected the main fragment of Gln at m/z 130. 1H NMR spectroscopy (right) produced a read out of specific protons based on their chemical environments, which are color-coded in red, blue and pink to match boxes of the same colors that outline the corresponding proton NMR signals.