
FIGURE 3.
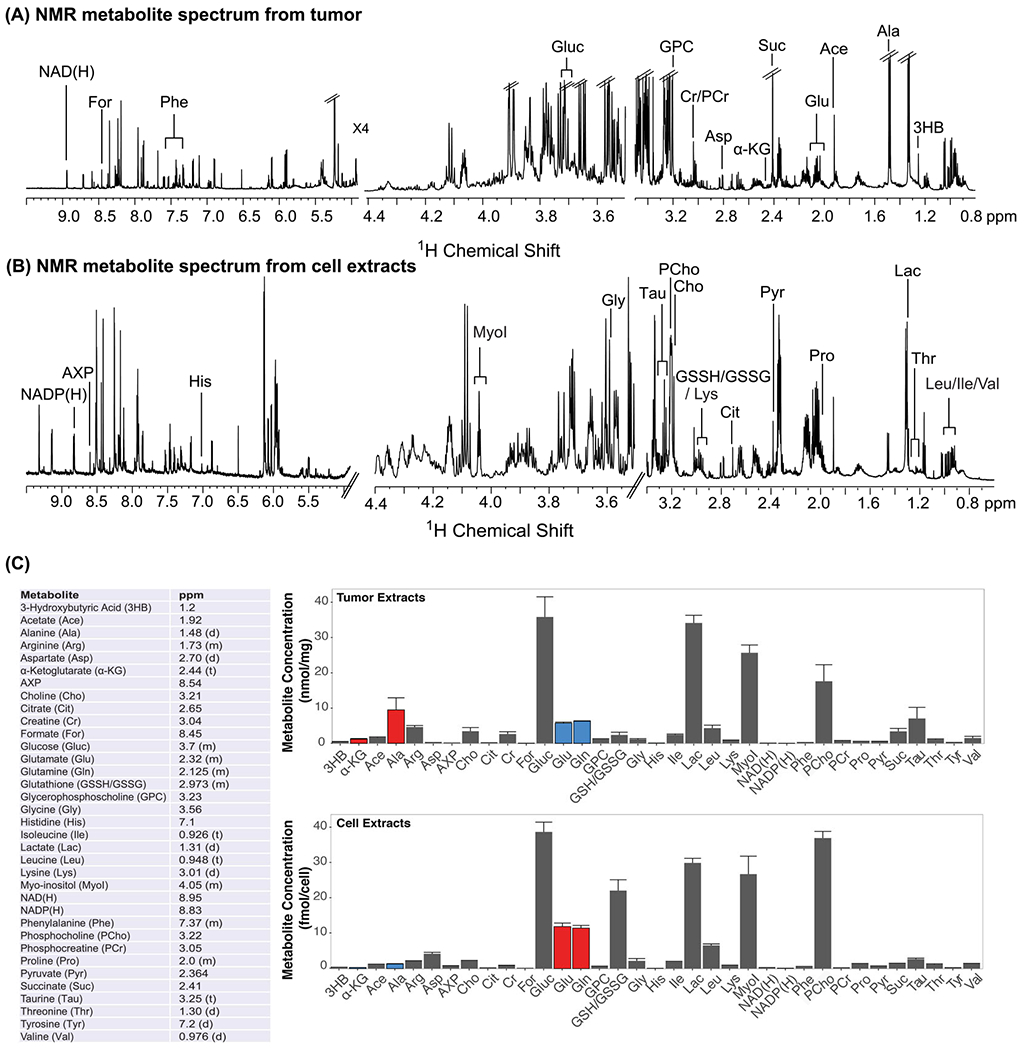
A, Representative metabolite 1H NMR spectra from MDA-MB-231 tumor xenografts. B, Representative metabolite1H NMR spectra from MDA-MB-231 cell extracts. C, Metabolites detected with 1H NMR spectroscopy in MDA-MB-231 cell and tumor xenografts and the chemical shift used for quantification are shown in the table. Average metabolite quantifications are shown from three biological repeats of tumor (top) and cell (bottom) extracts. Error bars represent standard error. While overall metabolic behavior was similar in MDA-MB-231 cells grown in culture as compared with orthotopic tumor growth, some differences existed, i.e., decreased Glu, Gln, pCho, and increased α-KG and Ala in tumors versus cells (blue bars indicate decreases, red bars indicate increases in tumors versus cells, relative to Gluc in the same sample. Significant changes were determined by a two-tailed t-test, with p < 0.5 considered significant.