
FIGURE 5.
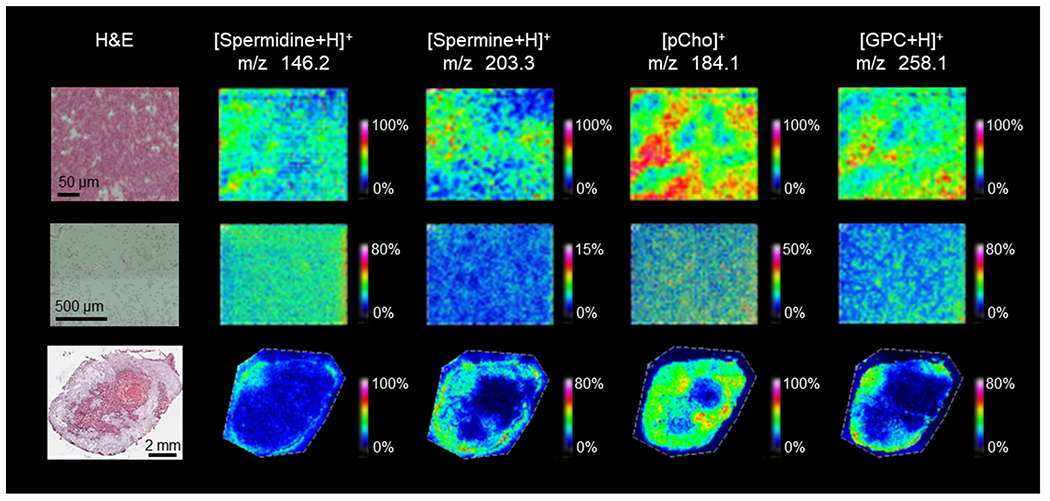
Metabolites identified in MDA-MB-231 cell pellets (top row), slide-grown cells (middle row) and tumor xenograft sections (bottom row) in MALDI imaging experiments with corresponding H&E images (left). Metabolites were identified using a combination of high mass resolution data (Supporting Table S1) and tandem MS data (Supporting Figures S7–S10). Images shown represent the entire imaged area with a mass filter at the reported m/z with a selection window of ±0.05 Da.