
FIGURE 6.
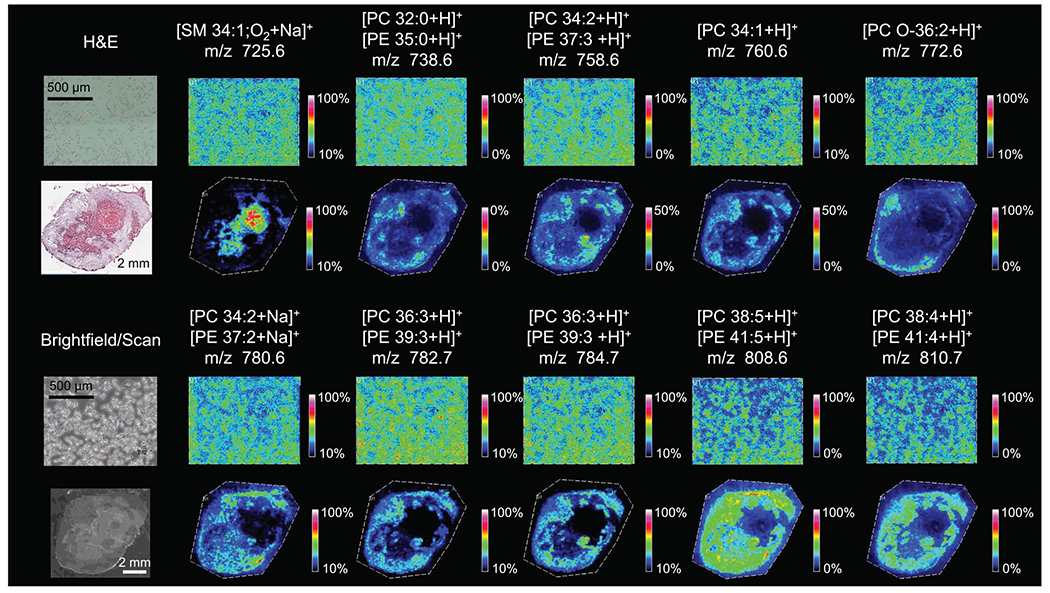
Phospholipids identified in slide-grown MDA-MB-231 cells (top and third rows) and MDA-MB-231 tumor xenograft sections (second and fourth rows) in MALDI imaging experiments with corresponding H&E stain and bright field images. Phospholipids were identified using a combination of high mass resolution data (Supporting Table S1) and tandem MS data (Supporting Figures S11–S20). For images where two phospholipids are reported, high mass resolution data were unable to distinguish between the two lipids and there is evidence for fragments from both species in the tandem MS experiments. Images shown represent the entire imaged area with a mass filter at the reported m/z with a selection window of ±0.05 Da.