
FIGURE 7.
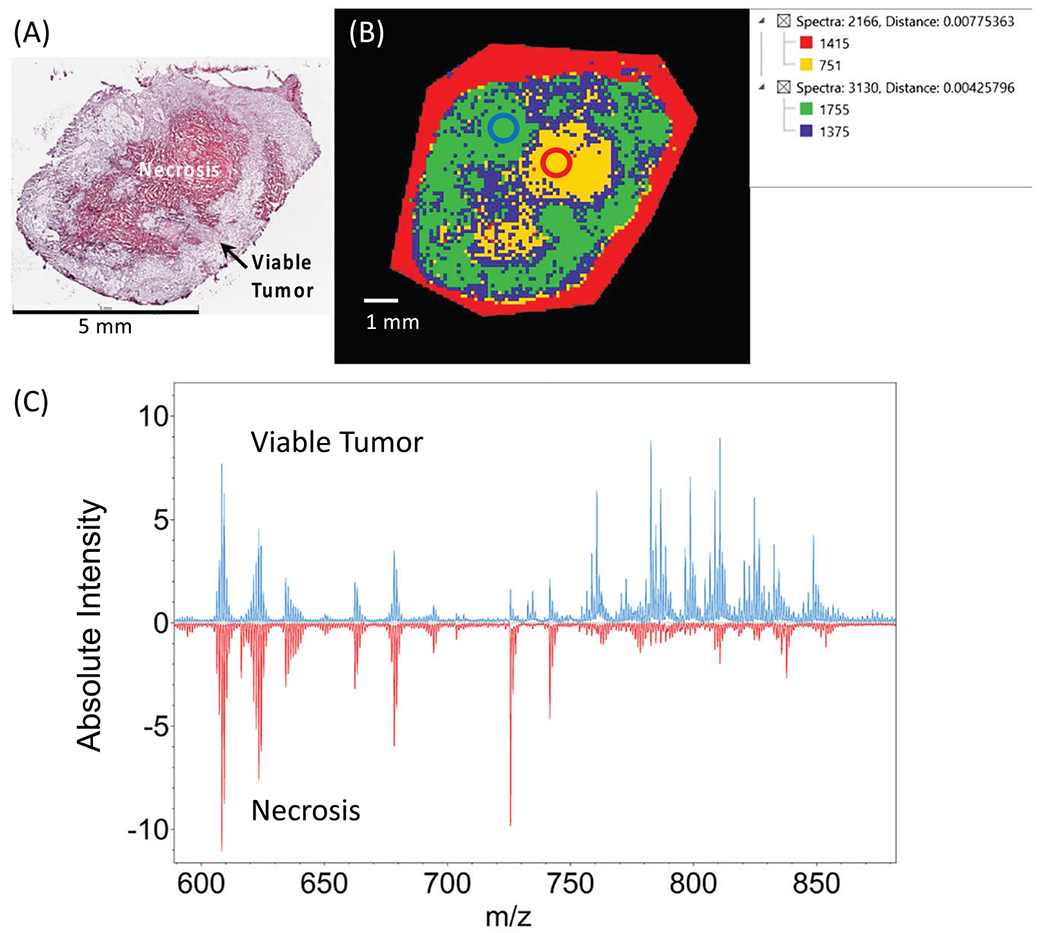
A, B, H&E stain from orthotopic MDA-MB-231 breast tumor xenograft section (A) with SCiLS Lab segmentation map from the same tumor section (B). C, MALDI spectra from the labeled regions of interest circled in B. Average spectra from viable tumor region (blue circle in B) are displayed in blue. Average spectra from necrotic tumor region (red circle in B) are displayed in red.