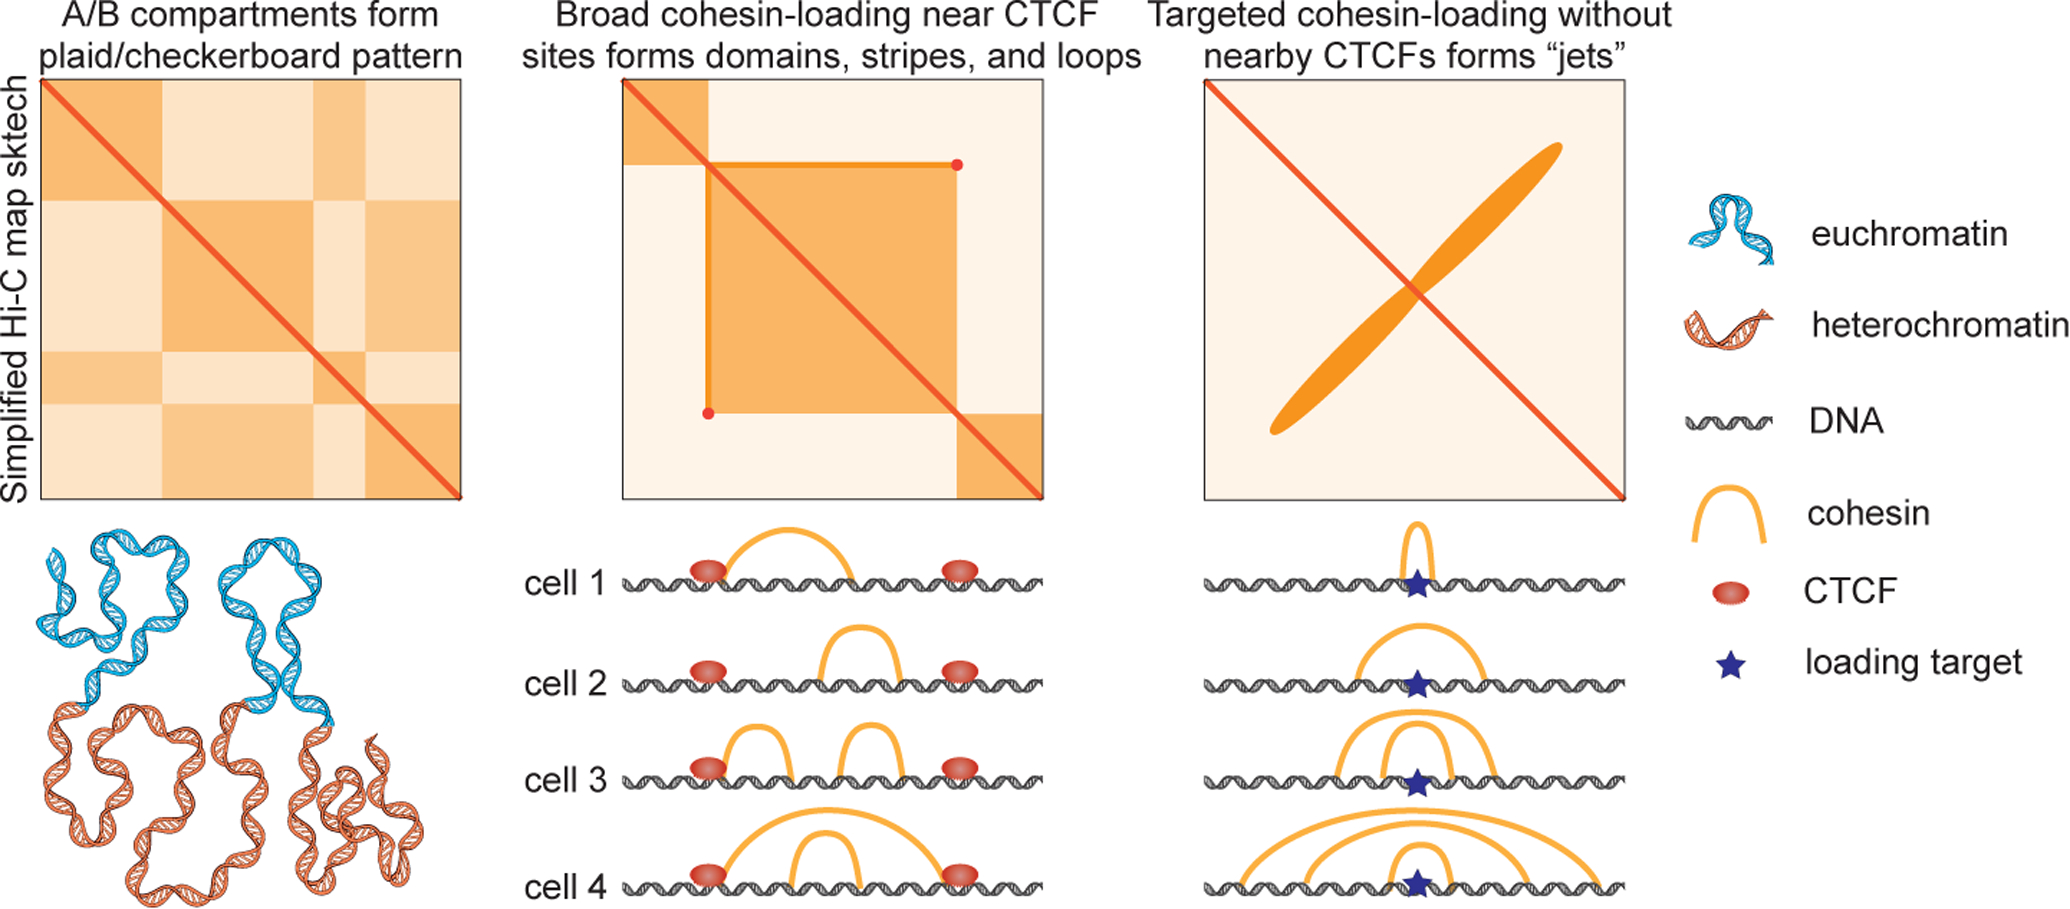
Figure 1. Hi-C contact maps provide insights into the mechanisms of 3D genome structure regulation.

Top: Simplified sketches of Hi-C contact maps showing A/B-compartments (left), TADs, loops, and stripes (middle), and “jets” (right), with likely mechanisms shown below. A/B compartments form due to self-segregation of euchromatin and heterochromatin. TADs, stripes, and loops arise from cohesin looping in broad regions bounded by extrusion barriers such as CTCF boundaries. Jets result from focal cohesin loading in a narrow region and subsequent bidirectional extrusion without nearby extrusion barriers.
