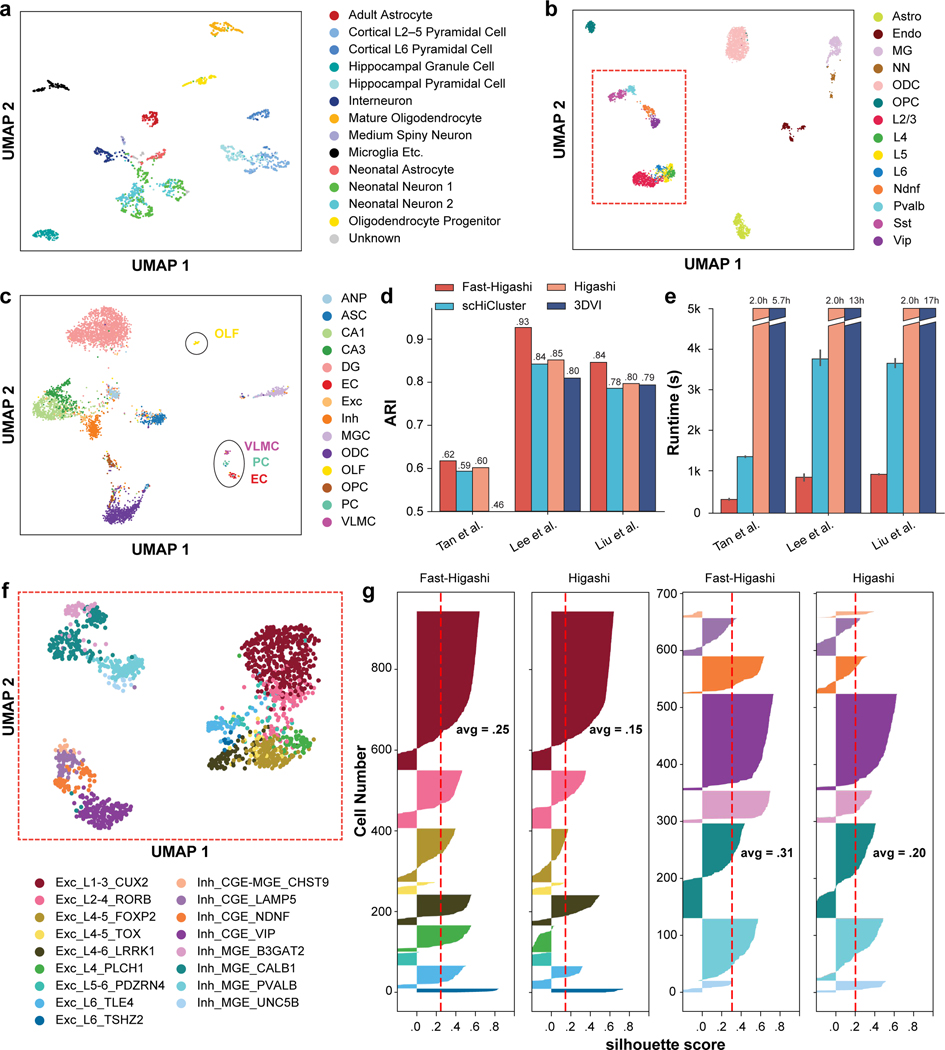
Figure 2: Evaluation of Fast-Higashi for generating embeddings for scHi-C data.
a. UMAP visualization of the Fast-Higashi embeddings for the (Tan et al., 2021) dataset (GEO:GSE162511). See also Fig. S7. b. UMAP visualization of the Fast-Higashi embeddings for the (Lee et al., 2019) dataset (GEO:GSE130711). Cells in the red box are neuron cells. c. UMAP visualization of the Fast-Higashi embeddings for the (Liu et al., 2021) dataset (GEO:GSE156683). See also Fig. S2. d. Quantitative evaluation based on adjusted rand index (ARI) scores of the Louvain clustering results for each scHi-C embedding methods. See also Fig. S3. e. Runtime of different embedding methods across different datasets. f. UMAP visualization of the Fast-Higashi embeddings for the neuron cells in the Lee et al. dataset (cells in the red box in (b)). Cell type information is from (Luo et al., 2022). See also Fig. S1. g. Quality of the embeddings for the neuron cells in the Lee et al. dataset measured as silhouette coefficients for neuron subtypes. See also Fig. S4. All cell type abbreviations are consistent with the data source.

