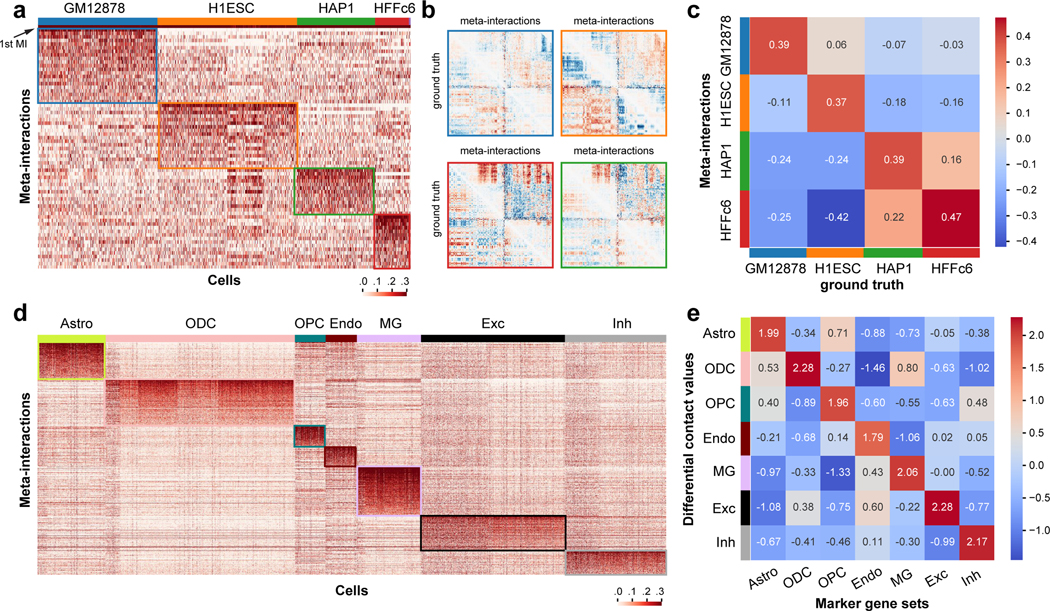
Figure 3: Analysis of the chromatin meta-interactions generated by Fast-Higashi.

a. Heatmap of the single cell loadings for each meta-interaction of chromosome 1 for the (Kim et al., 2020) dataset. b. Visualization of the differential contact maps generated based on meta-interactions and those generated based on bulk Hi-C (marked with “ground truth”). Border color matches the cell type color in (a). c. Spearman correlation between differential contact maps generated based on meta-interactions and those generated based on bulk Hi-C (marked with “ground truth”). d. Heatmap of the single cell loadings for each meta-interaction of the whole genome for the (Lee et al., 2019) dataset. e. Mean differential contact values of the lists of cell type marker genes averaged for each cell type. The mean differential contact values are calculated using the corresponding meta-interactions as the summation of values for each bin in the meta-interaction contact map. For each cell type, the top 200 marker genes were identified using Seurat (Stuart et al., 2019).
