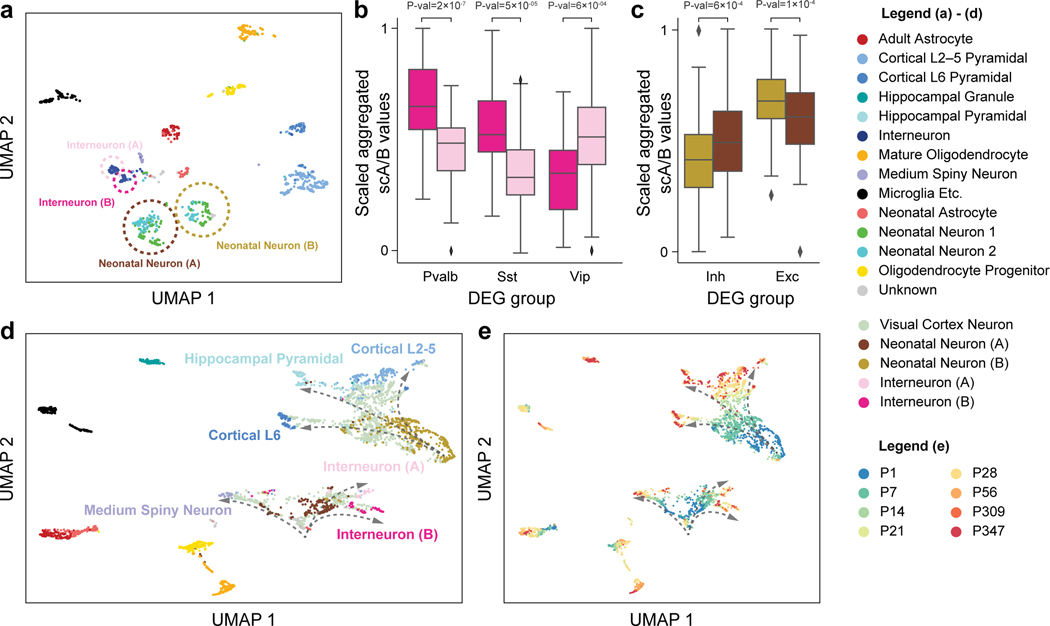
Figure 4: Application of Fast-Higashi to the (Tan et al., 2021) scHi-C dataset of the mouse developing brain for more detailed identification of cell types and developmental trajectories.
a. UMAP visualization of the Fast-Higashi embeddings for the cortex cells in the Tan et al. dataset (GEO:GSE162511). Cell subtypes identified by Fast-Higashi are highlighted with circles and texts. b. Distribution of the scaled aggregated single-cell A/B values for interneuron (A) and interneuron (B) subtypes identified by Fast-Higashi. For better visualization, the aggregated single-cell A/B values are linearly scaled to the range from 0 to 1 for each differentially expressed gene (DEG) group. c. Distribution of the scaled aggregated single-cell A/B values for Neonatal Neuron (A) and Neonatal Neuron (B) subtypes identified by Fast-Higashi. The scaling is the same as in panel (b). d-e. UMAP visualization of the joint Fast-Higashi embeddings of visual cortex, cortex, and hippocampus scHi-C datasets in (Tan et al., 2021) (GEO:GSE162511). The potential developmental trajectories from neonatal neurons to fully mature neurons are marked by dashed arrows. Note that here (d) is colored with cell type labels and (e) is colored with ages of the mouse.

