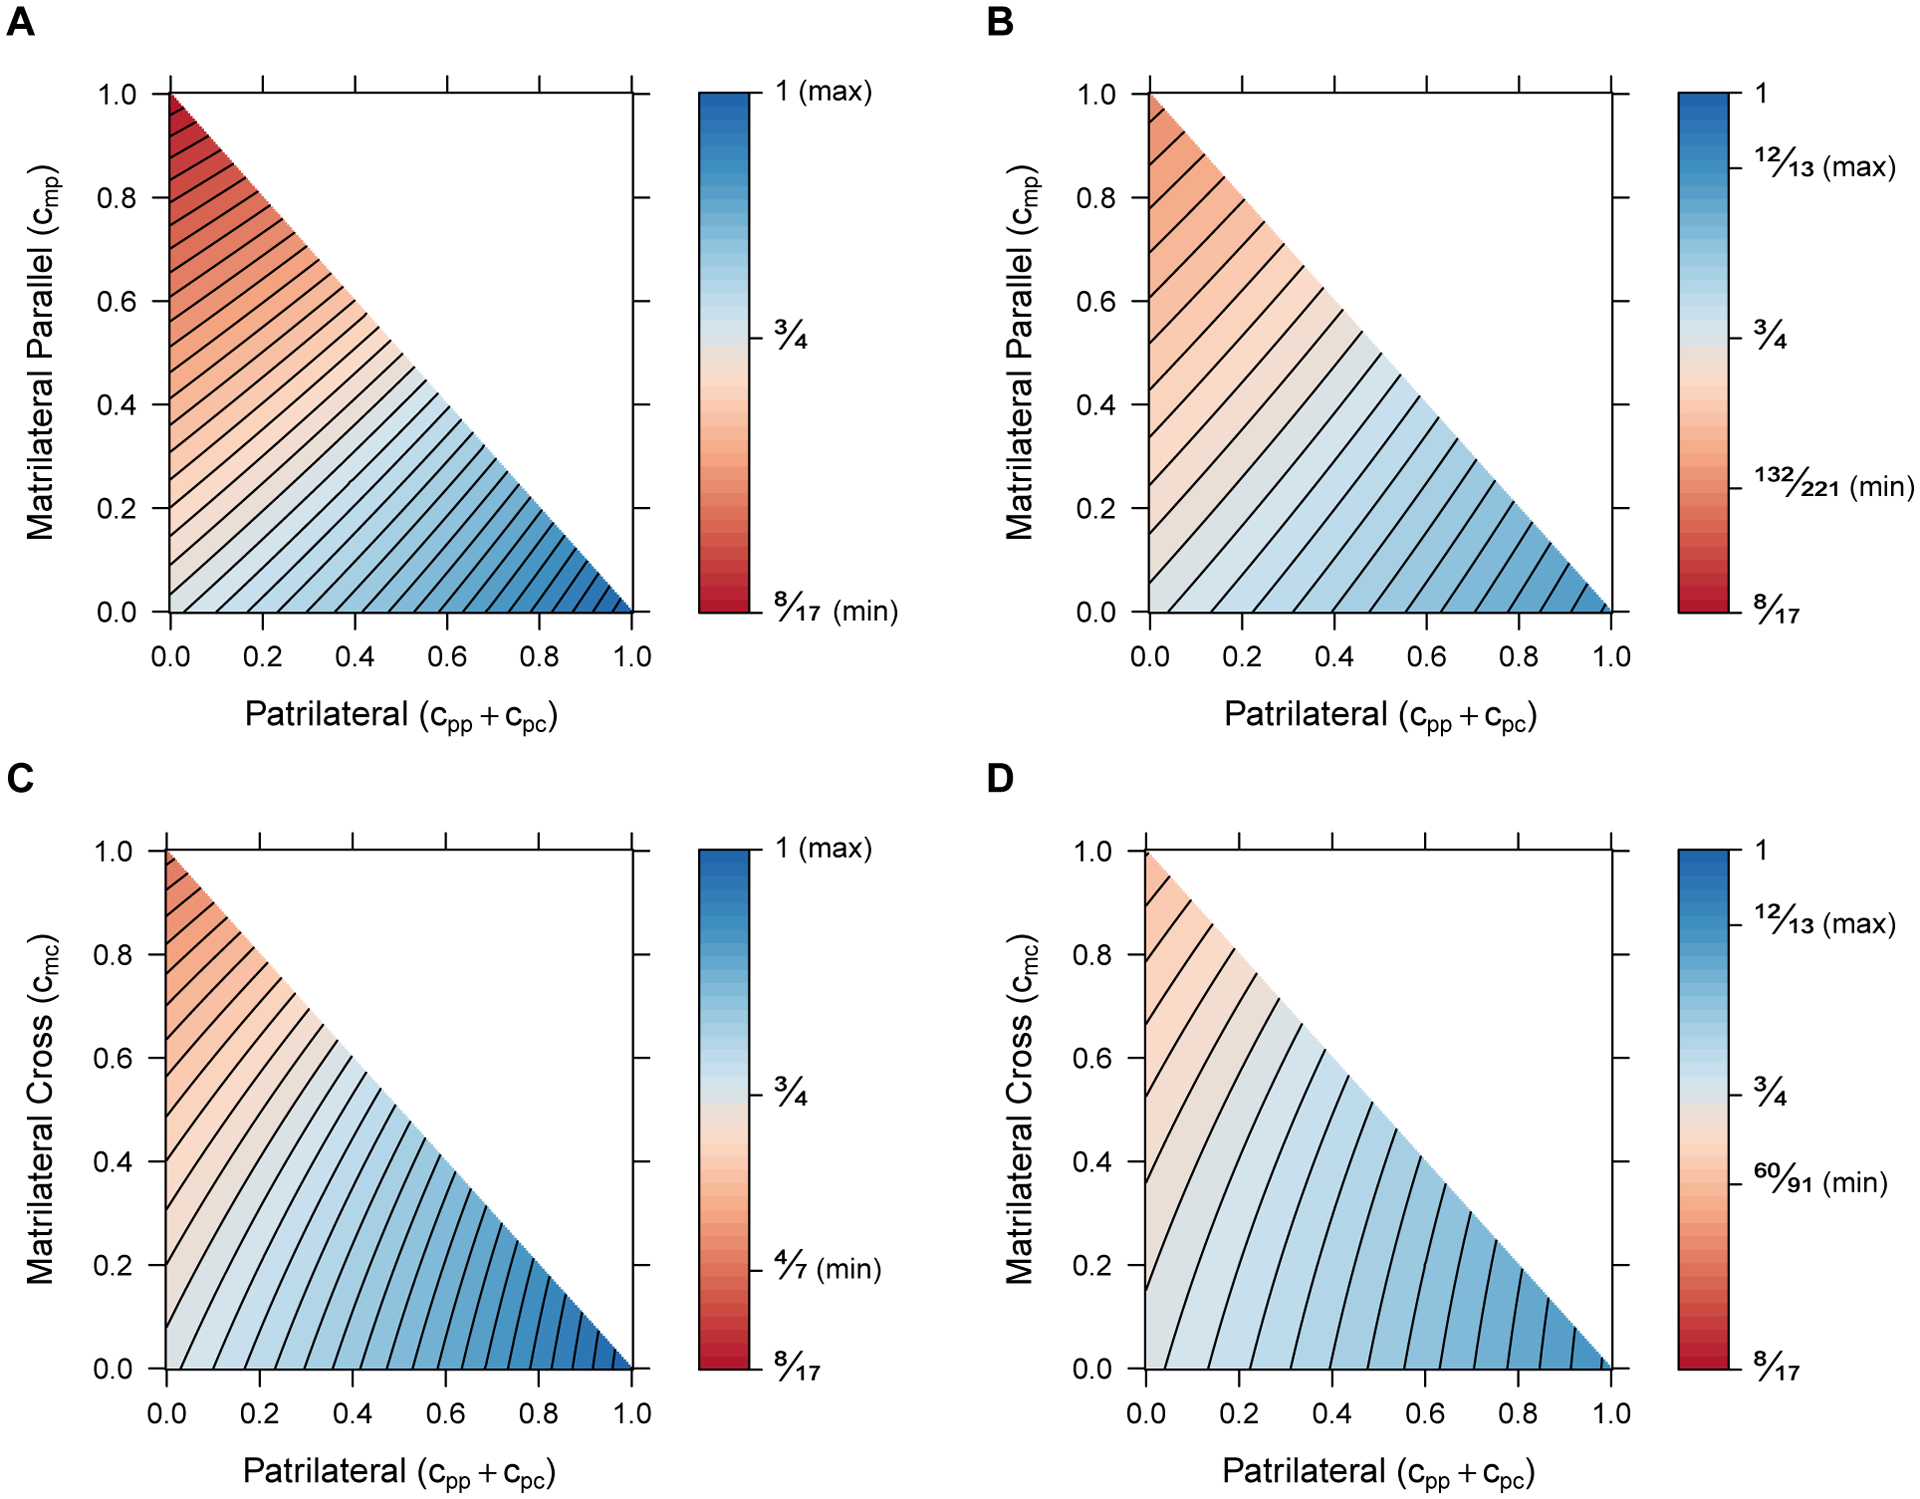
Figure 8:

Ratios of X-chromosomal and autosomal mean coalescence times. Each point represents a ratio of coalescence times for a specified mixture of two types of consanguinity, depicted on the x and y axes. (A) Within individuals, matrilateral parallel and patrilateral consanguinity (Eq. 39/Eq. C4). (B) Between individuals, matrilateral parallel and patrilateral consanguinity (Eq. 40/Eq. C5). (C) Within individuals, matrilateral cross and patrilateral consanguinity (Eq. 39/Eq. C4). (D) Between individuals, matrilateral cross and patrilateral consanguinity (Eq. 40/Eq. C5). In each panel, the minimal ratio is indicated (obtained by setting matrilateral consanguinity to 1 and patrilateral consanguinity to 0), as is the maximum (obtained by setting matrilateral consanguinity to 0 and patrilateral consanguinity to 1). The value occurs with no consanguinity, located at the origin in each panel. Values greater than appear in blue, indicating combinations of parameter values that bring expected X chromosomal coalescence times closer to expected autosomal coalescence times. Values that reduce X chromosomal coalescence times to a greater extent than on autosomes, thereby shifting the ratio less than , appear in red. Contour lines divide [, 1] into equal-sized intervals.
