Figure 3.

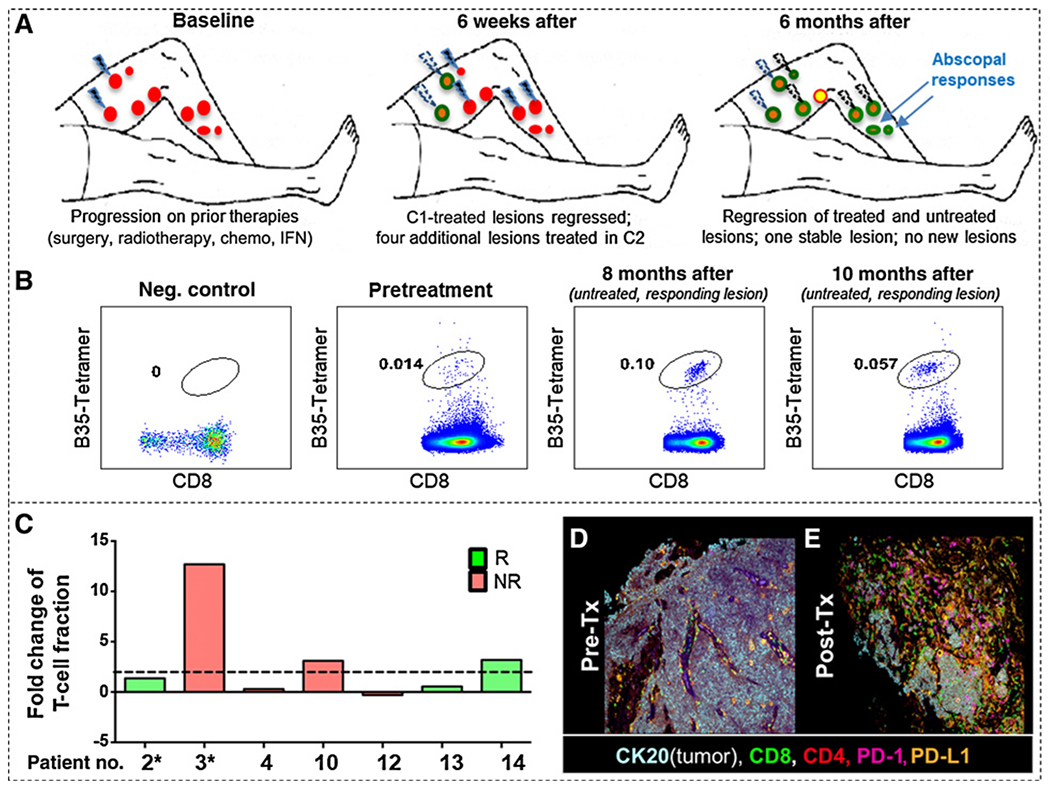
Regression of treated and untreated lesions is associated with robust T-cell responses and infiltration. A, Schema of treatment and response in Pt#2 with baseline (red circles), regressed lesions (green circles), a persistent lesion (yellow circle). Lesions treated with i.t.-tavo-EP are shown as lightning bolts (blue: current cycle; white: prior cycles). Two untreated lesions that regressed are shown in top right panel (blue arrows). B, Tetramer staining of MCPyV-specific CD8 T cells from TIL from pre- and posttherapy from Pt#2. Tetramer-positive CD8 T cells are circled in each panel. Negative control is an HLA mismatched donor. C, T-cell receptor (TCR) beta chain sequencing was used to determine TCR variable beta chain diversity using ImmunoSeq V3 (Adaptive Biotechnology) from pre- and posttreatment tumor specimens (patient number is shown on x-axis, and * denotes patients in whom the pre- and posttreatment samples were from different lesions). Data are presented as fold change (a ratio of the difference between the posttreatment T-cell fraction and pretreatment T-cell fraction over the pretreatment T-cell fraction). Bars are colored in correlation with clinical response: responder (R, green) and nonresponder (NR, red). The dotted line denotes a greater than or equal to 2-fold change. D and E, Multispectral IHC images of pretreatment show an MCC tumor (CK20, white/light blue) with very few infiltrating T cells (CD8 in green and CD4 in red; D). Three weeks after treatment (E), there was a large infiltrate of CD8 T cells (green), accompanied by increased PD-1 (magenta) and PD-L1 (orange) and loss of tumor (CK20, white/light blue). C1, cycle 1; C2, cycle 2; no., number; RT, radiotherapy; Tx, treatment.
