Fig. 3.
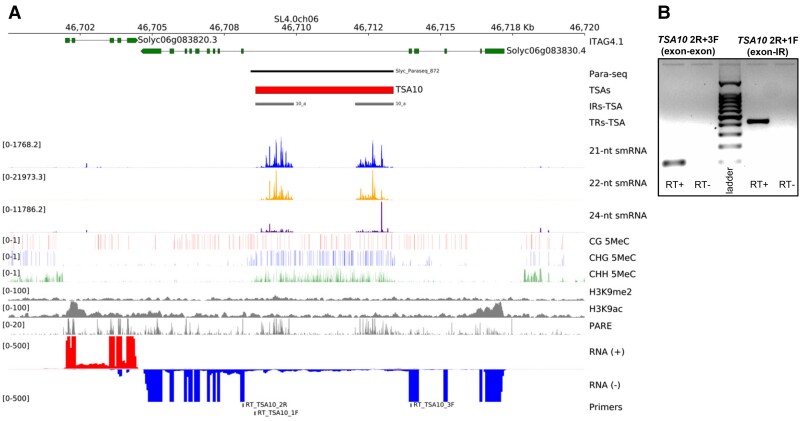
Genomics of an exemplary Solanum lycopersicum TSA. (A) Genome-browser data around TSA10 coordinates. Data visualized includes ITAG4.1 gene models (green), recognized pararetroviral sequences (Para-seq, black), proposed positions for TSAs (red), inverted- and tandem-repeats in TSAs (IRs-TSA and TRs-TSA, grey and white), mapping siRNA signals (21-nt = blue, 22-nt = orange, and 24-nt = indigo), DNA methylation in CG (red), CHG (blue), and CHH (green) sequence contexts (H denoting any base but G), leaves’ histone modifications signals for H3K9me2 and H3K9ac (grey), degradome PARE-seq signals (grey), positive (red), and negative (blue) strands RNA-seq signals from pooled tissues (leaves, flowers and meristems), and primers positions for RT-PCR assays. (B) TSA10 RT-PCR transcript signals. Exon–exon, splicing product; exon-IR (inverted-repeat), non-splicing product; with expected size of 102 and 434 bp, respectively. Ladder = 1,000 bp ladder; RT+, reaction with reverse-transcriptase; RT–, negative control reaction without addition of reverse-transcriptase.

