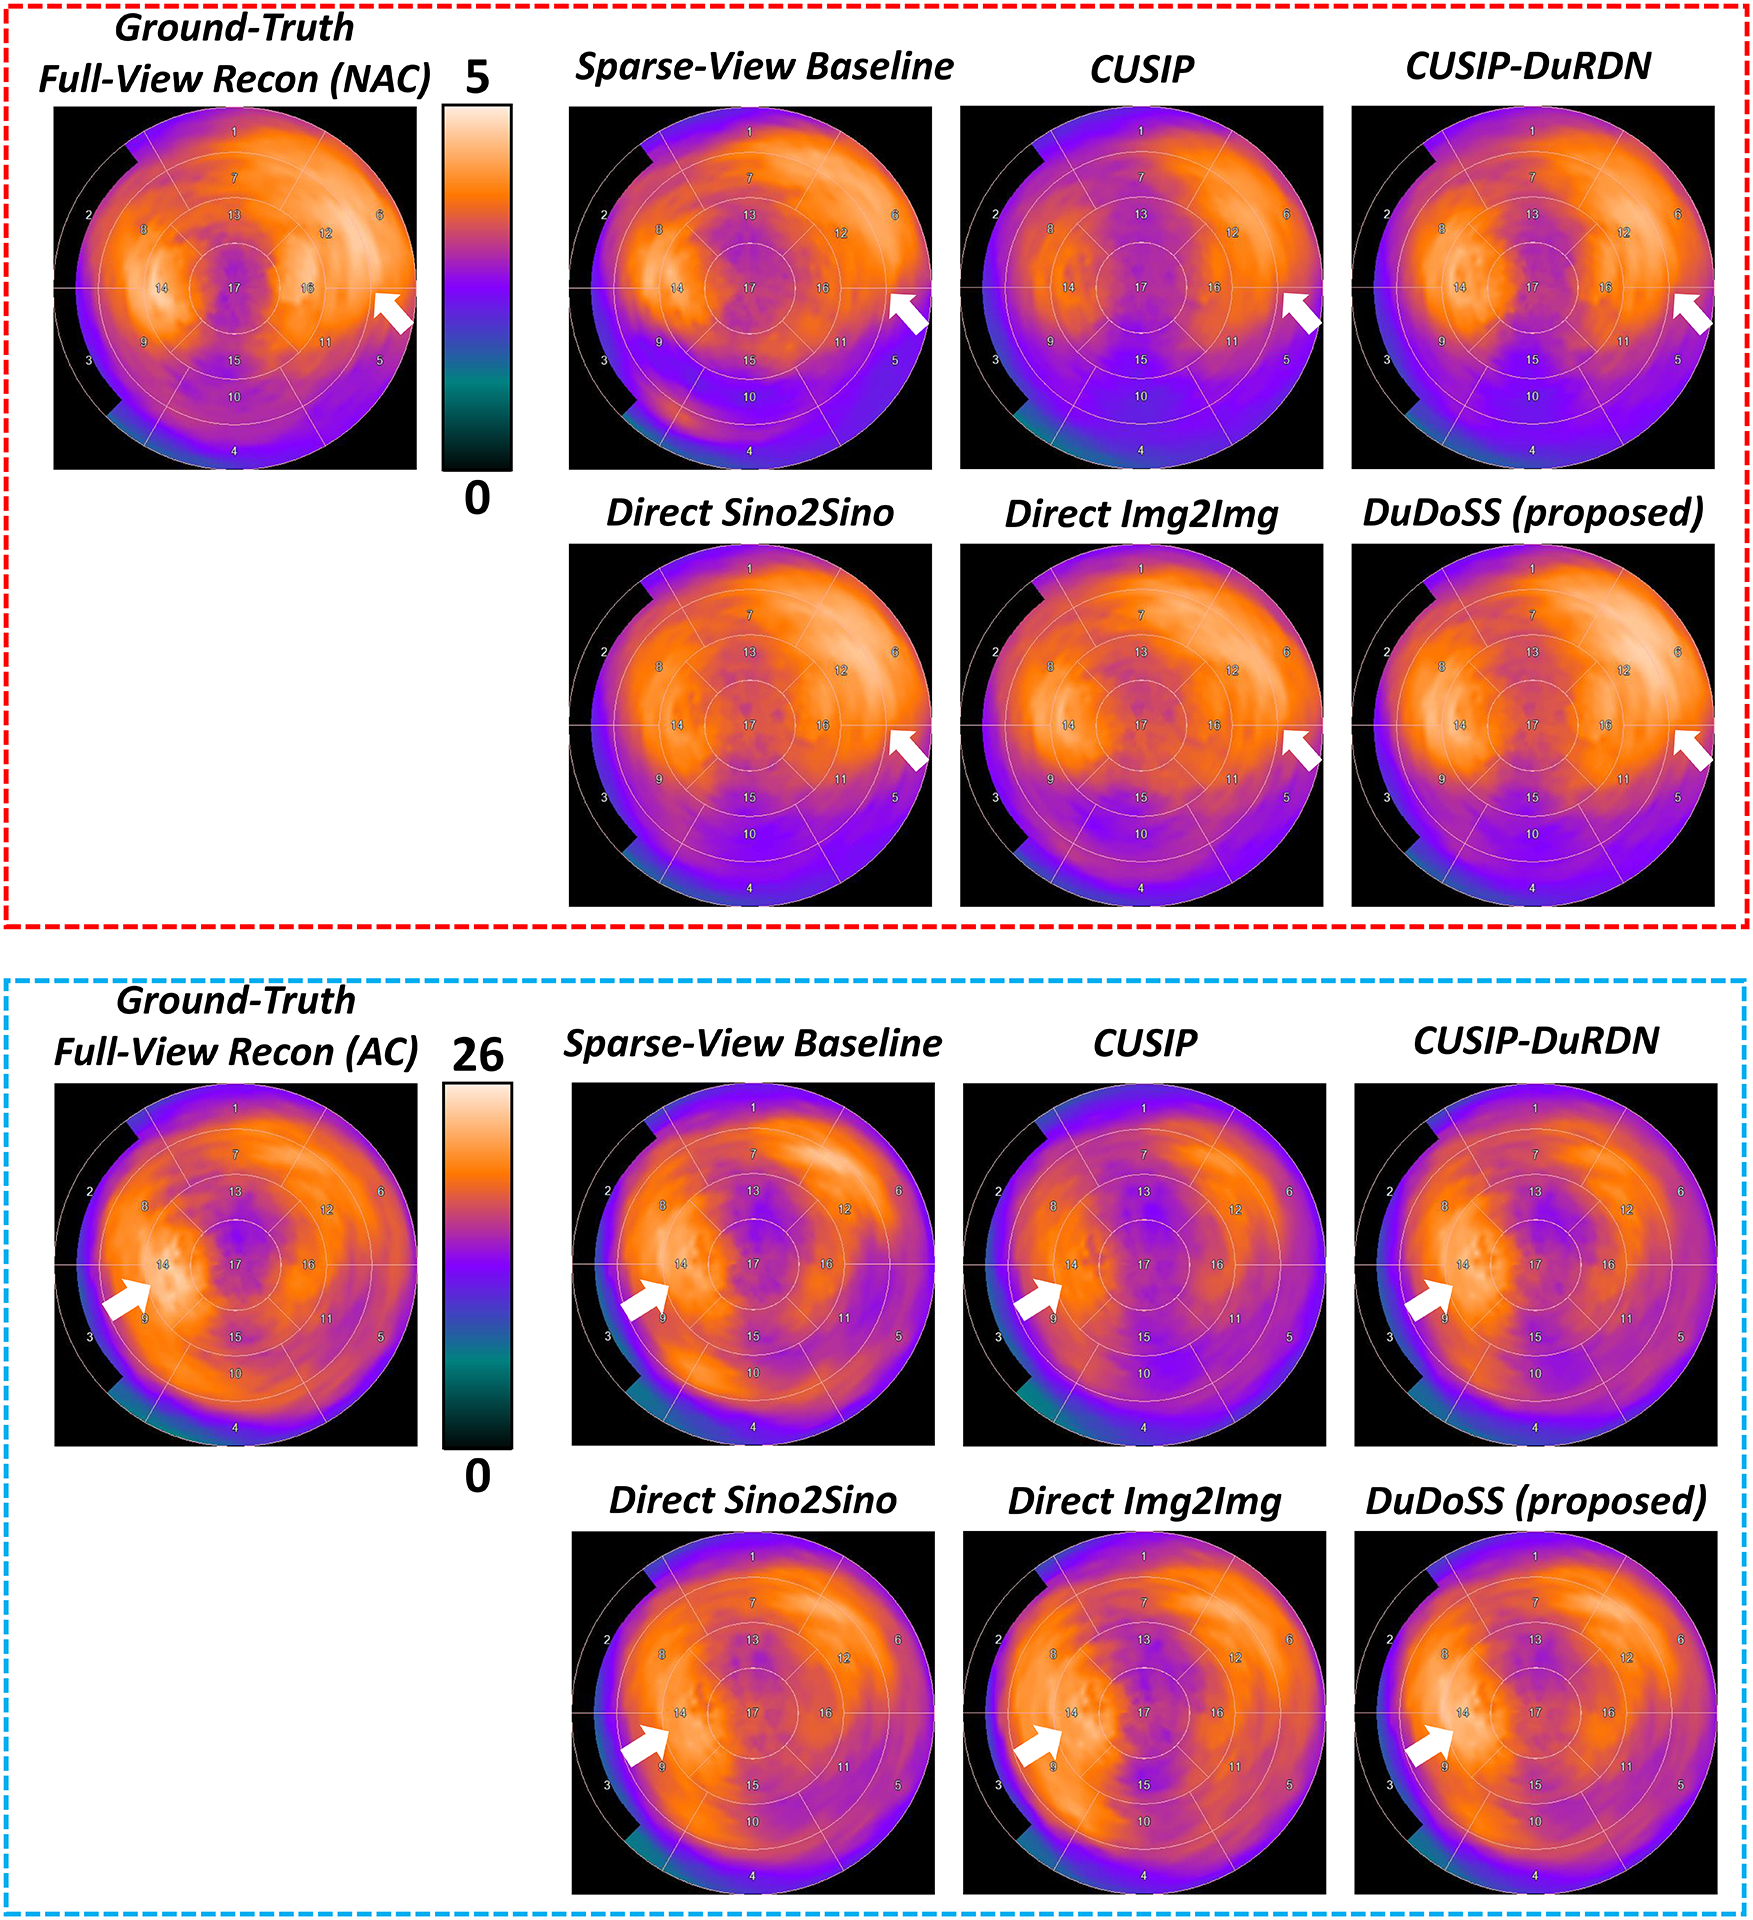
FIGURE 6.

Standard 17-segment polar maps of sample NAC and AC SPECT images. The polar maps of the NAC SPECT images are shown in the top red dash box, and the polar maps of the AC SPECT images are shown in the bottom blue dash box. DuDoSS outputs the most consistent polar maps with the ground-truth polar maps of both NAC and AC SPECT images. Errors between the predicted and ground-truth polar maps are denoted with white arrows.
