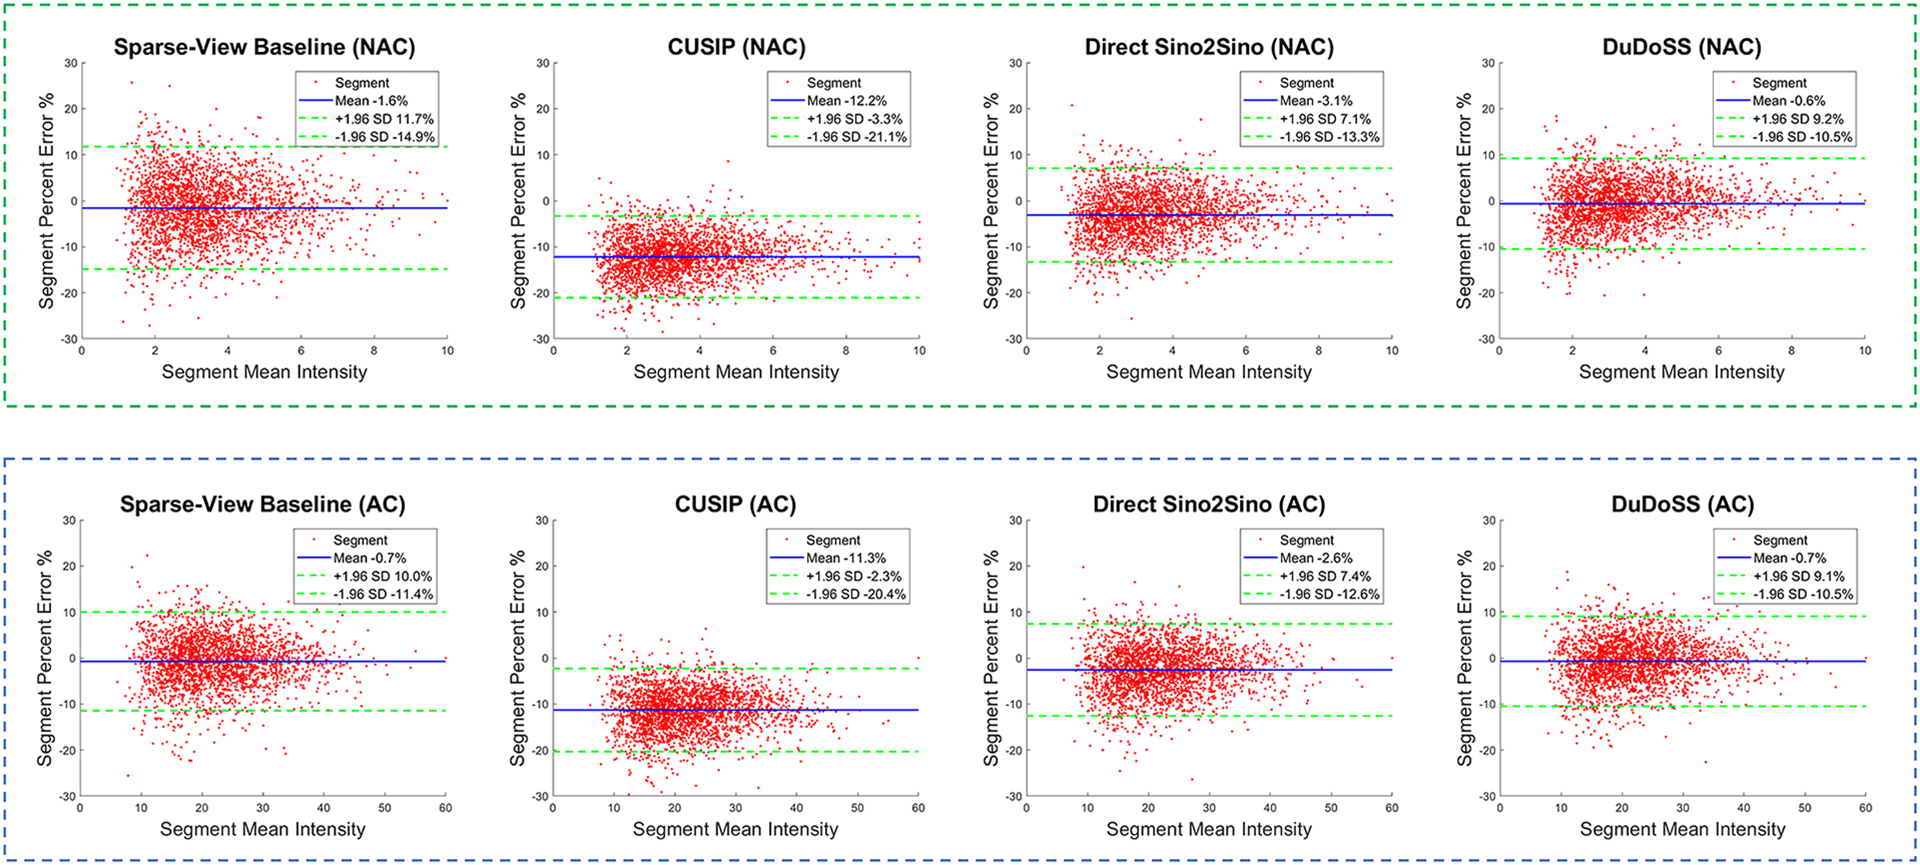
FIGURE 8.

Bland-Altman plots of segment PE between the predicted and the ground-truth full-view NAC and AC SPECT images of the 150 testing patient studies. In each plot, the mean errors are denoted with blue solid lines, and the 97.5% confidence interval (±1.96 standard deviations) are denoted as green dash lines. In both NAC and AC images, the errors of CUSIP obviously deviate from the center line y = 0, which leads to much higher absolute errors than other groups. In contrast, the error of DuDoSS concentrates more densely along y = 0, showing lower segment-wise errors than other groups.
