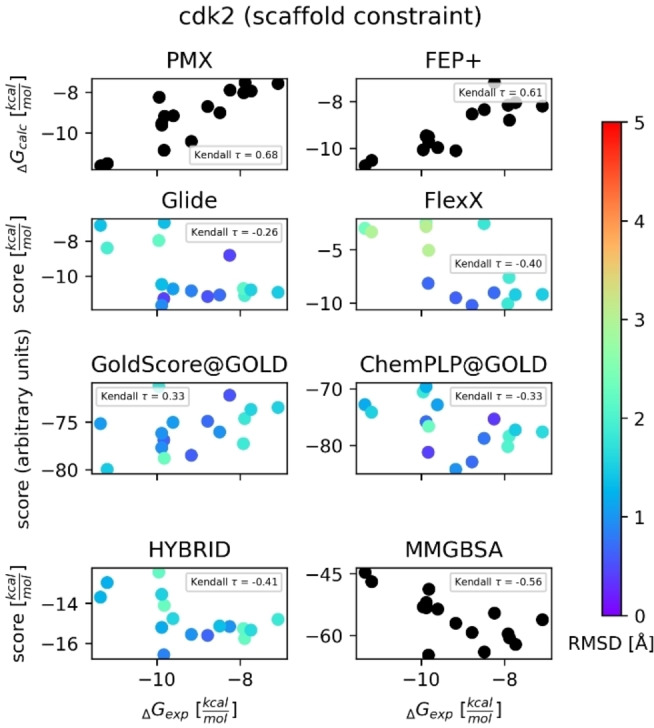
Figure 3.

Scatter plot of predicted binding free energies/docking scores vs. experimental binding free energies for cdk2. Results for non‐constrained docking algorithms are shown here. The color map shows RMSD (Å) of each compound (we did not compute RMSD values for MD‐based methods (PMX, FEP+) and MM/GBSA calculations since it is not applicable to these methods). FEP+ and PMX results were retrieved from Refs. [11b] and [22b], respectively. The relative free energy differences were converted into free energy differences with Arsenic. [27]
