
Figure 6. ND vs. Diseased aECM Lung ECM Composition.
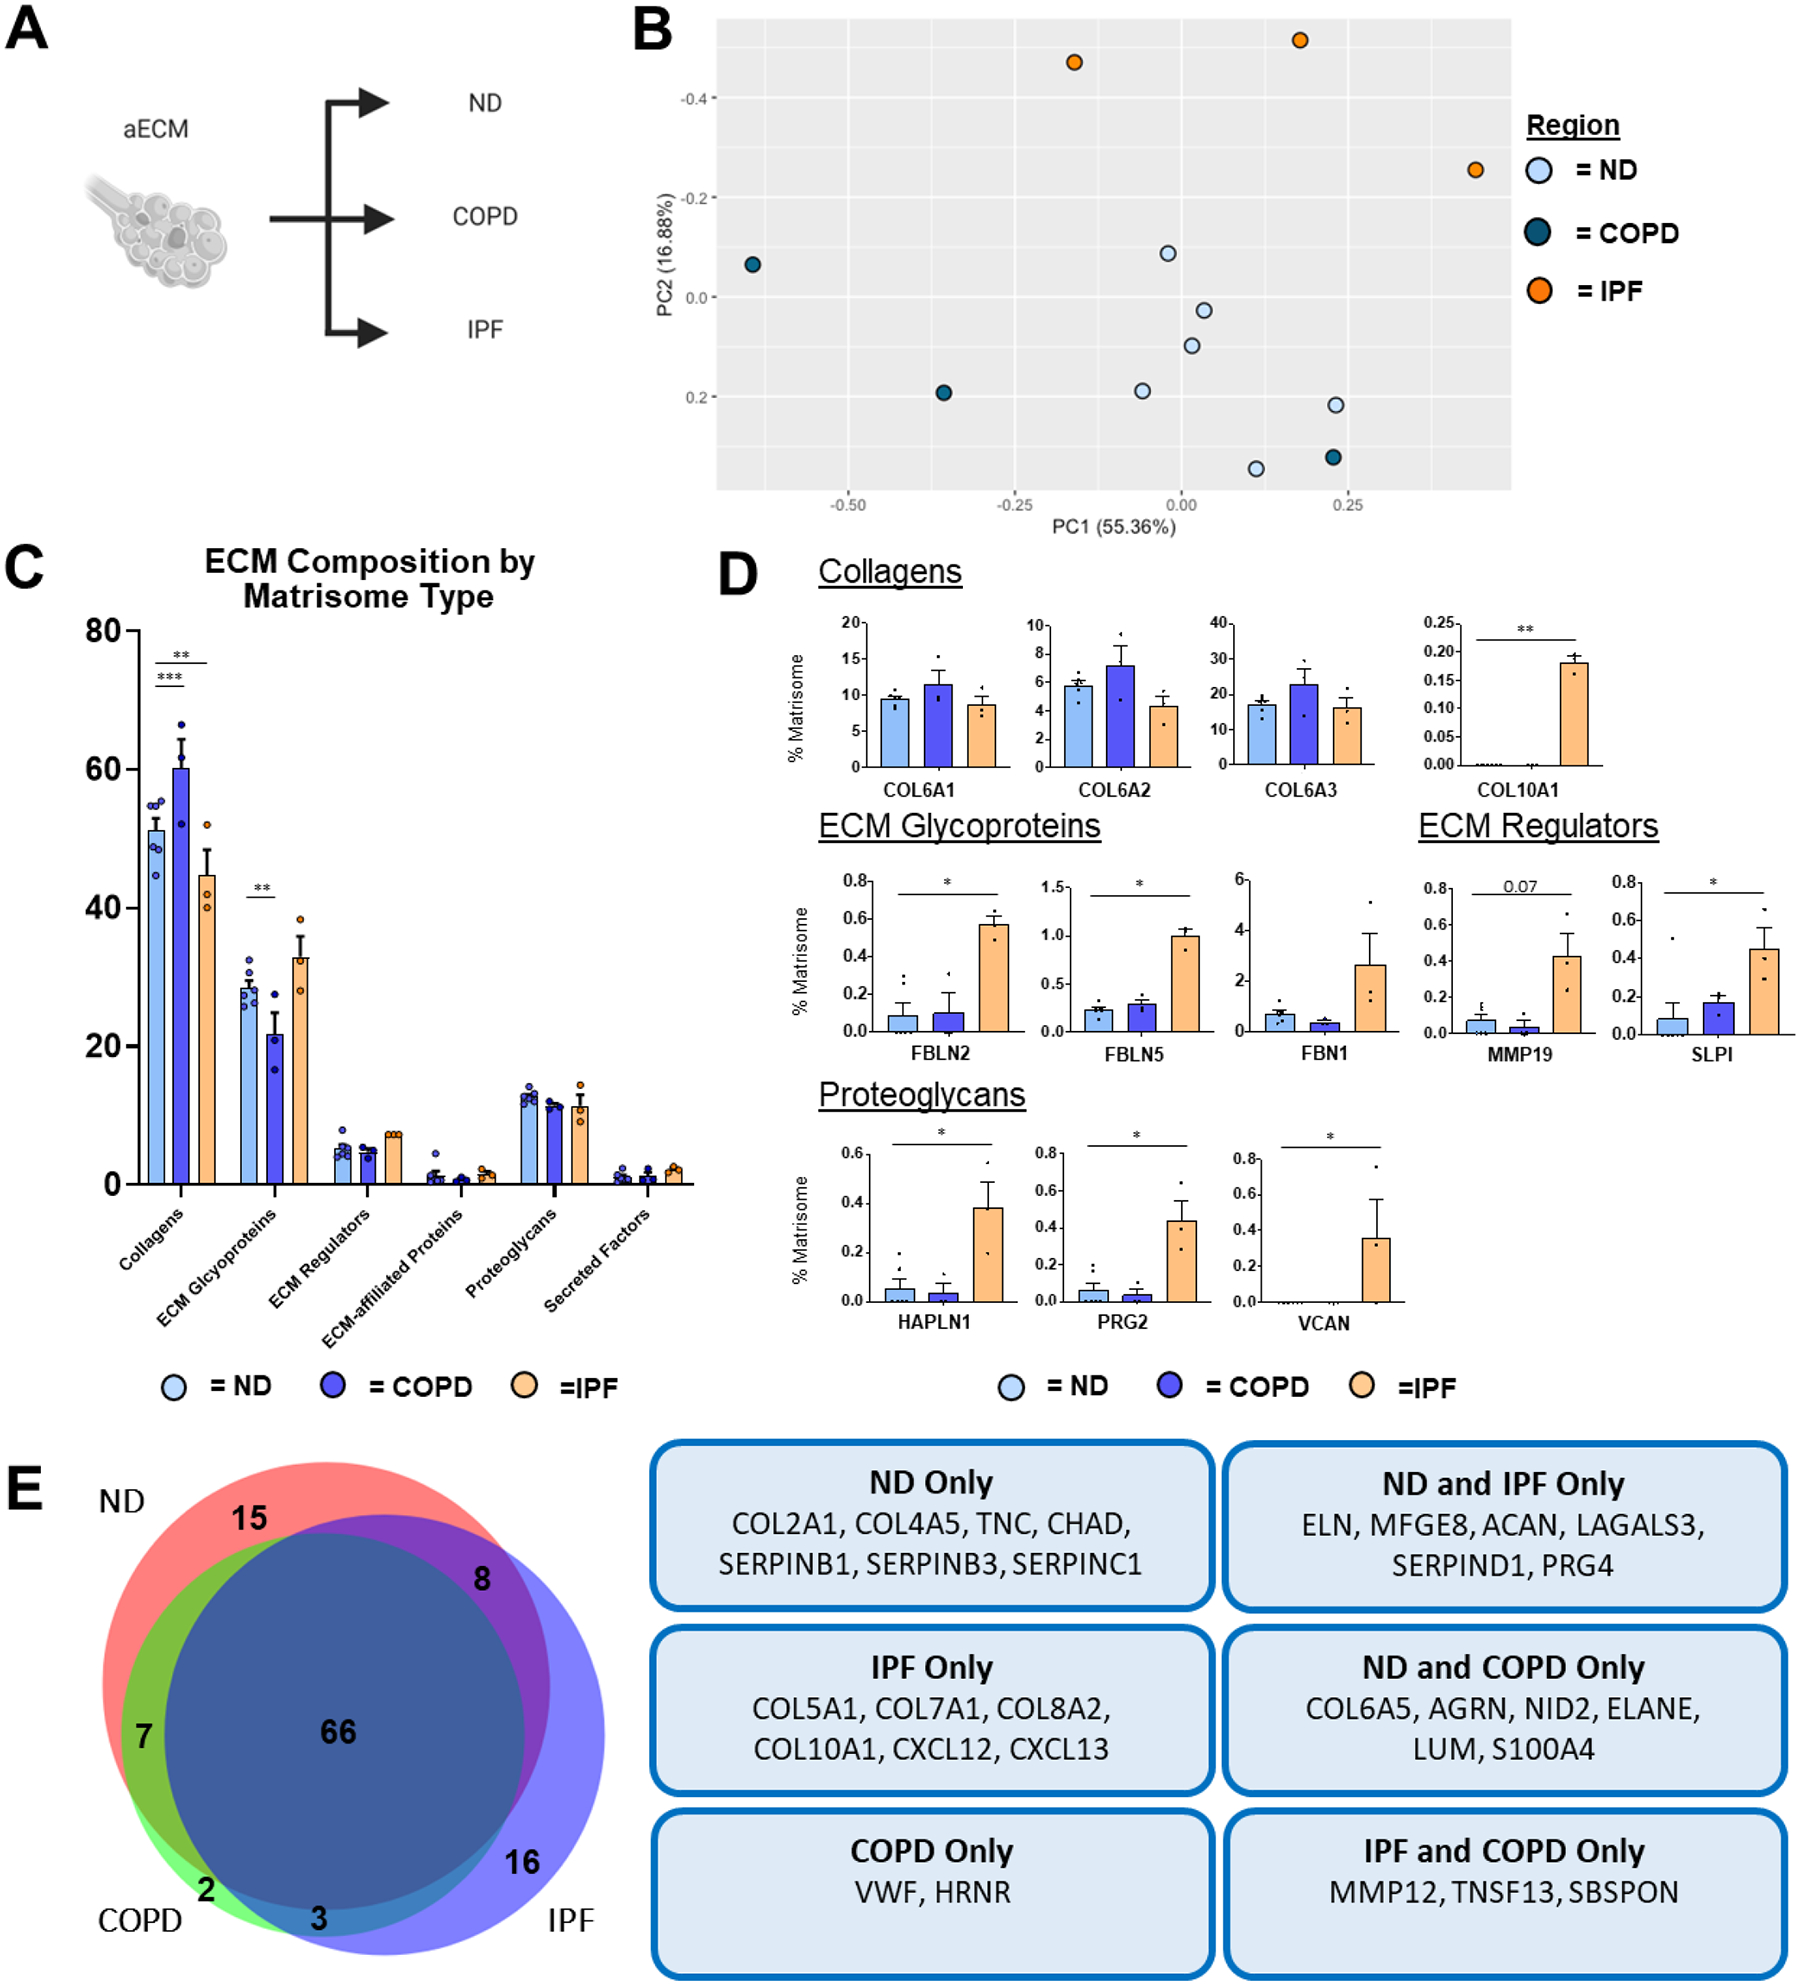
Proteomic analysis of aECM samples obtained from ND (n=6), COPD (n=3), and IPF (n=3) decellularized patient lung lobes. (A) Schematic depicting samples utilized for proteomic analysis. (B) PCA plot demonstrating similarity of aECM protein composition across lung conditions. Each data point represents the relative abundance (%) of all individual aECM proteins (normalized to abundance of total aECM composition) within each respective sample.(C) Relative abundance (%) of aECM protein type (normalized to total aECM composition within each respective sample) within each respective sample). (D) Comparison of normalized individual aECM proteins across lung conditions. Bars in (C,D) indicate mean +/− SEM; *p<0.05, **p<0.01 using Dunn’s method. Statistical trends are identified if 0.05≤p<0.1. (E) Qualitative Venn diagram depicting differences in aECM proteins of pooled samples by condition.