
FIGURE 2.
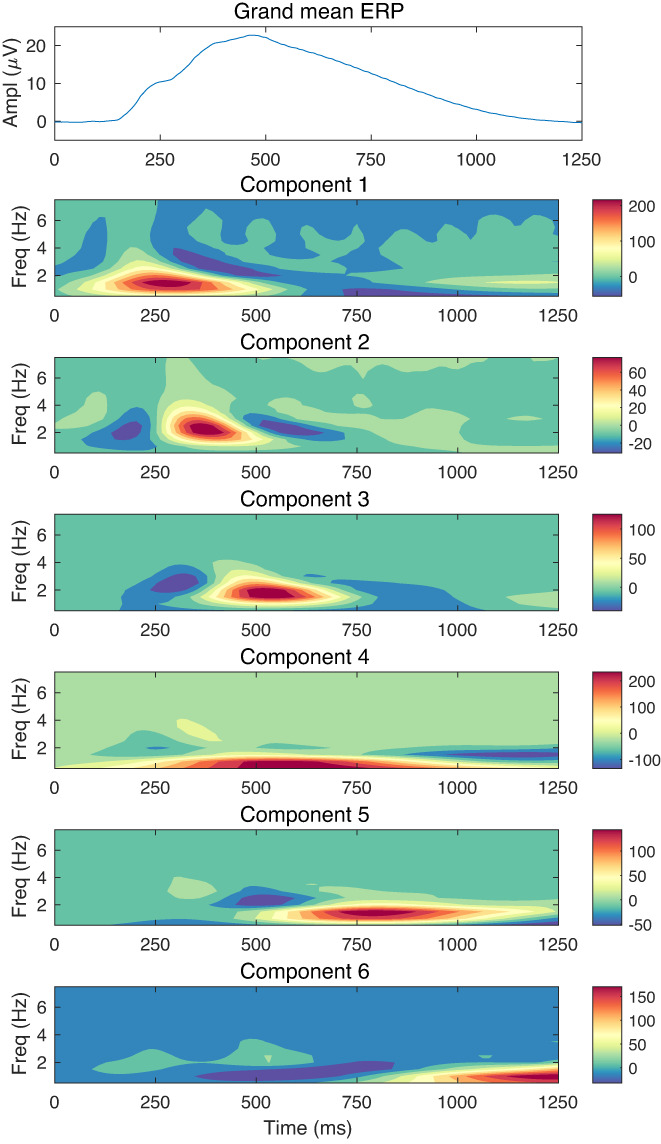
Average ERP and component loadings across assessment ages of 11 to 24. The average grand‐ mean ERP across assessment ages appears at the top. Heatmaps of loadings on each of the six components, averaged across assessment ages, appear below. Loadings have been weighted by each component's mean score to facilitate comparison of their relative contribution to the total time‐frequency energy. The grand mean ERP across all assessment ages appears in the top row.