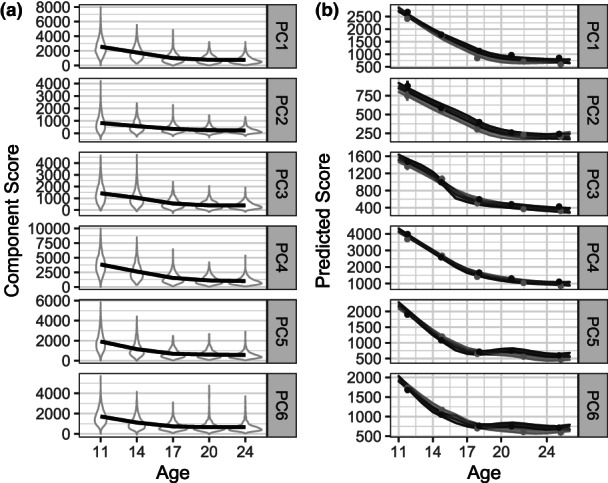
FIGURE 4.

Trajectories and distributions of component scores. Age‐related features of component scores are represented in two ways. Components are ordered as in Figure 2. Panel a: Distribution of scores at each assessment wave. Mean trajectories are modeled using a loess regression in ggplot2. Panel b: Trajectories of scores on matched components as predicted by smoothing spline models, with 95% confidence intervals around mean trajectories. Observed means are represented by filled circles, with 95% confidence intervals as vertical lines. Trajectories were allowed to vary by sex. Although there was substantial variation in actual age at each assessment, ages as a whole tended to cluster around the target ages, creating non‐uniform age support for the smoothing splines, which likely produced the occasional bump or dip in the predicted trajectories.
