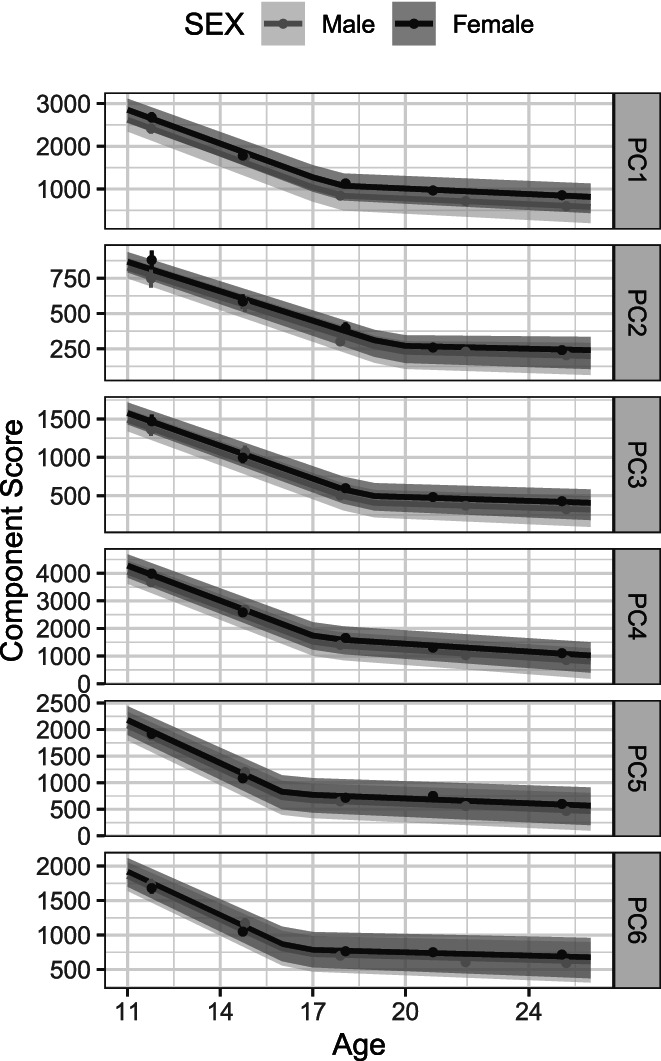
FIGURE 5.

Model‐implied trajectories of change in time‐frequency components. The change point, or knot, was estimated separately for each component, and trajectories are plotted separately for males and females. Observed (measured) means are represented by filled circles, with 95% confidence intervals around them as vertical lines. The scale of the ordinate was allowed to vary across plots to emphasize detail in model‐ predicted trajectories.
