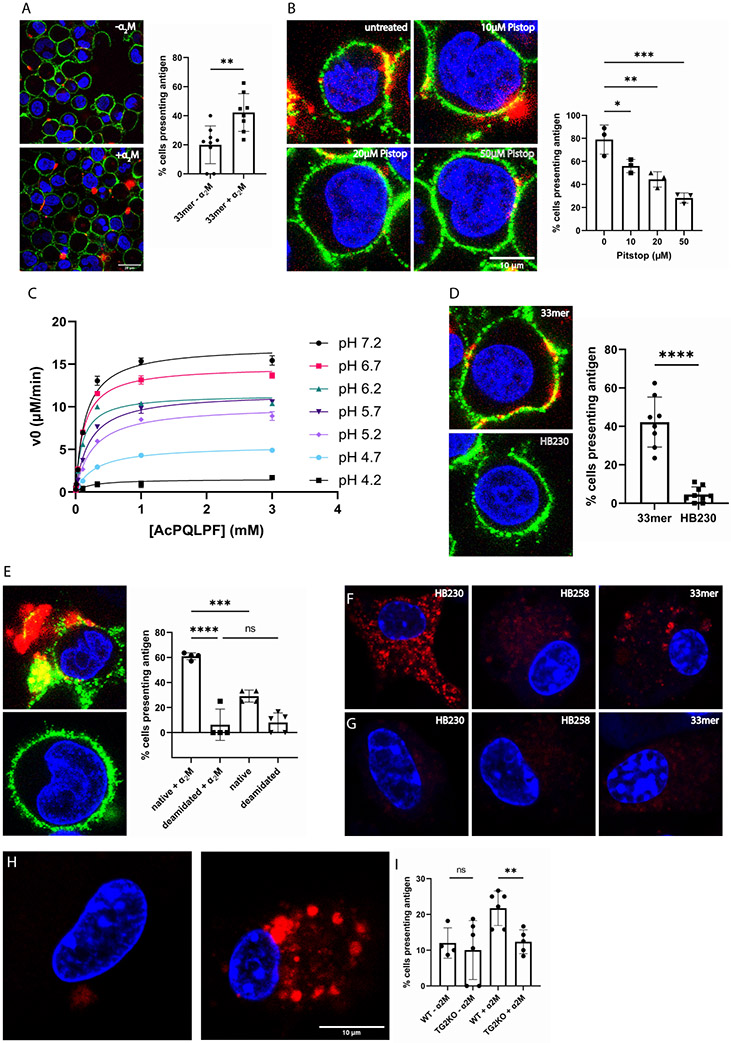
Figure 5:
HLA-DQ2 expressing B-cells (9022) present gluten peptides on the cell surface in an α2M dependent manner. (A) In the presence of α2M (right) the number of cells displaying gluten peptides on their surface increases compared to treating with peptide alone (left). The bar graph shows quantification over 150 cells from 2-4 frames of 3-6 experimental replicates. (B) Inhibition of clathrin mediated endocytosis with the tool compound Pitstop decreases cell surface presentation of gluten peptides in a dose-dependent manner. (C) Steady-state kinetic analysis of TG2-catalyzed deamidation of Ac-PQLPF-NH2 in response to increasing acidification in the pH 4.2-7.2 range. Measurements done in triplicates. (D) The TG2 inhibitor HB230 is not recognized by HLA-DQ2, and therefore does not appear on the cell surface. (E) Under conditions where the native 33mer strongly labels the cell surface (top), its deamidated analog is less active (bottom) despite that the latter peptide has higher affinity for HLA-DQ2. In all experiments 9022 cells were treated with 100nM recombinant TG2. (F) Bone marrow derived dendritic cells (BMDCs) take up HB230 and 33mer, as previously described, whereas (G) no uptake is observed in BMDCs from TG2-knockout mice. (H) Macrophages from TG2- knockout mice also do not internalize 33mer (left) whereas macrophages from wild-type mice show robust uptake in the presence of α2M (right). (I) Quantification of 33mer uptake in wild-type and TG2-knockout bone marrow derived macrophages. Measurements done in triplicates. For wide views of all panels in this Figure, see Fig. S6. Blue staining is DAPI, green staining is HLA-DQ2, and red staining is Cy5-33mer or HB230 as indicated. In all bar graphs data are represented as mean ± SD.

