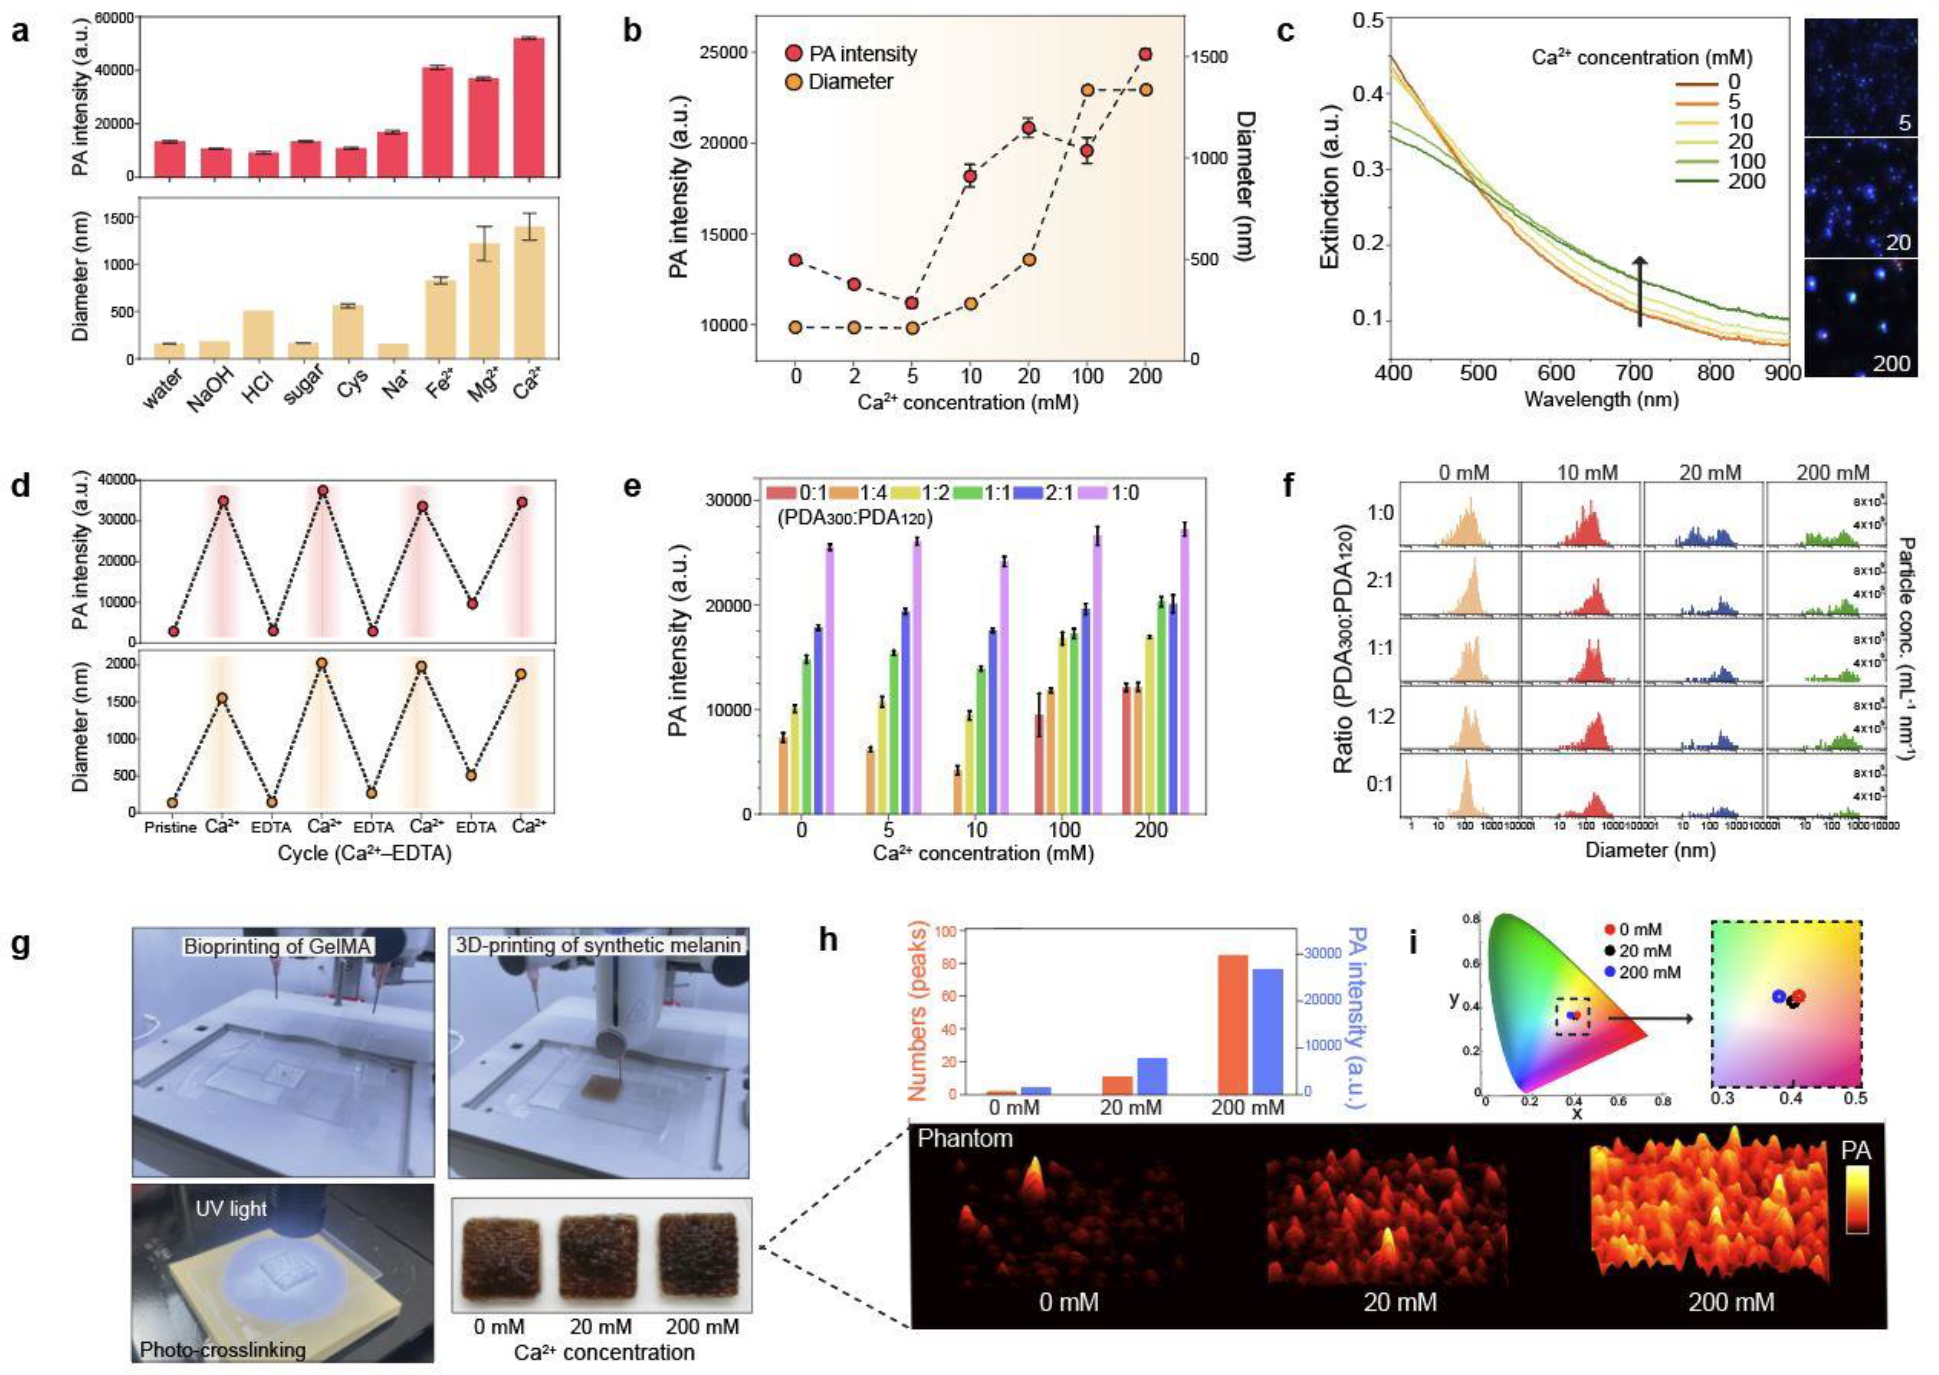
Figure 3. Clusters of synthetic melanin.

a, PA signal of PDA clusters. Different metal ions and other sample matrices were used to induce PDA clusters. The error bars represent the standard deviation of six regions-of-interest. b, PA signal of PDA clusters induced by different Ca2+ concentrations (from 0 to 200 mM). The error bars represent the standard deviation of six regions of interest. c, UV-vis spectra of PDA clusters at different Ca2+ concentration. M-NTA image shows higher light scattering (i.e., brighter) of PDA clusters (200 mM) than individual PDAs (0 mM). The intensity of the blue dots is proportional to light scattering. d, Reversible PA signal upon assembly-disassembly of PDA clusters. PA signal turned “on and off” under repeatedly adding EDTA and Ca2+ ions. e, PA signal of PDA mixtures at the same total number of particles. 0:1, 1:4, 1:2, 1:1, 2:1, and 1:0 indicate the particle number ratio of PDA300 to PDA120. f, Particle distributions of PDA mixtures at different Ca2+ concentrations. g, 3D bioprinting process of skin-tone phantom. The photograph shows the same skin phototype (Fitz. 6) of three-printed phantoms. h, PA signal of 3D-bioprinted phantoms containing PDA mixtures with 0, 20, and 200 mM of Ca2+ ions. PA signal increased as more PDA clusters led to PA punctuate images. i, CIE coordinates of 3D-printed phantoms containing different amounts of PDA clusters. The experiments in a, b, d, and h were repeated independently three times with similar results.
