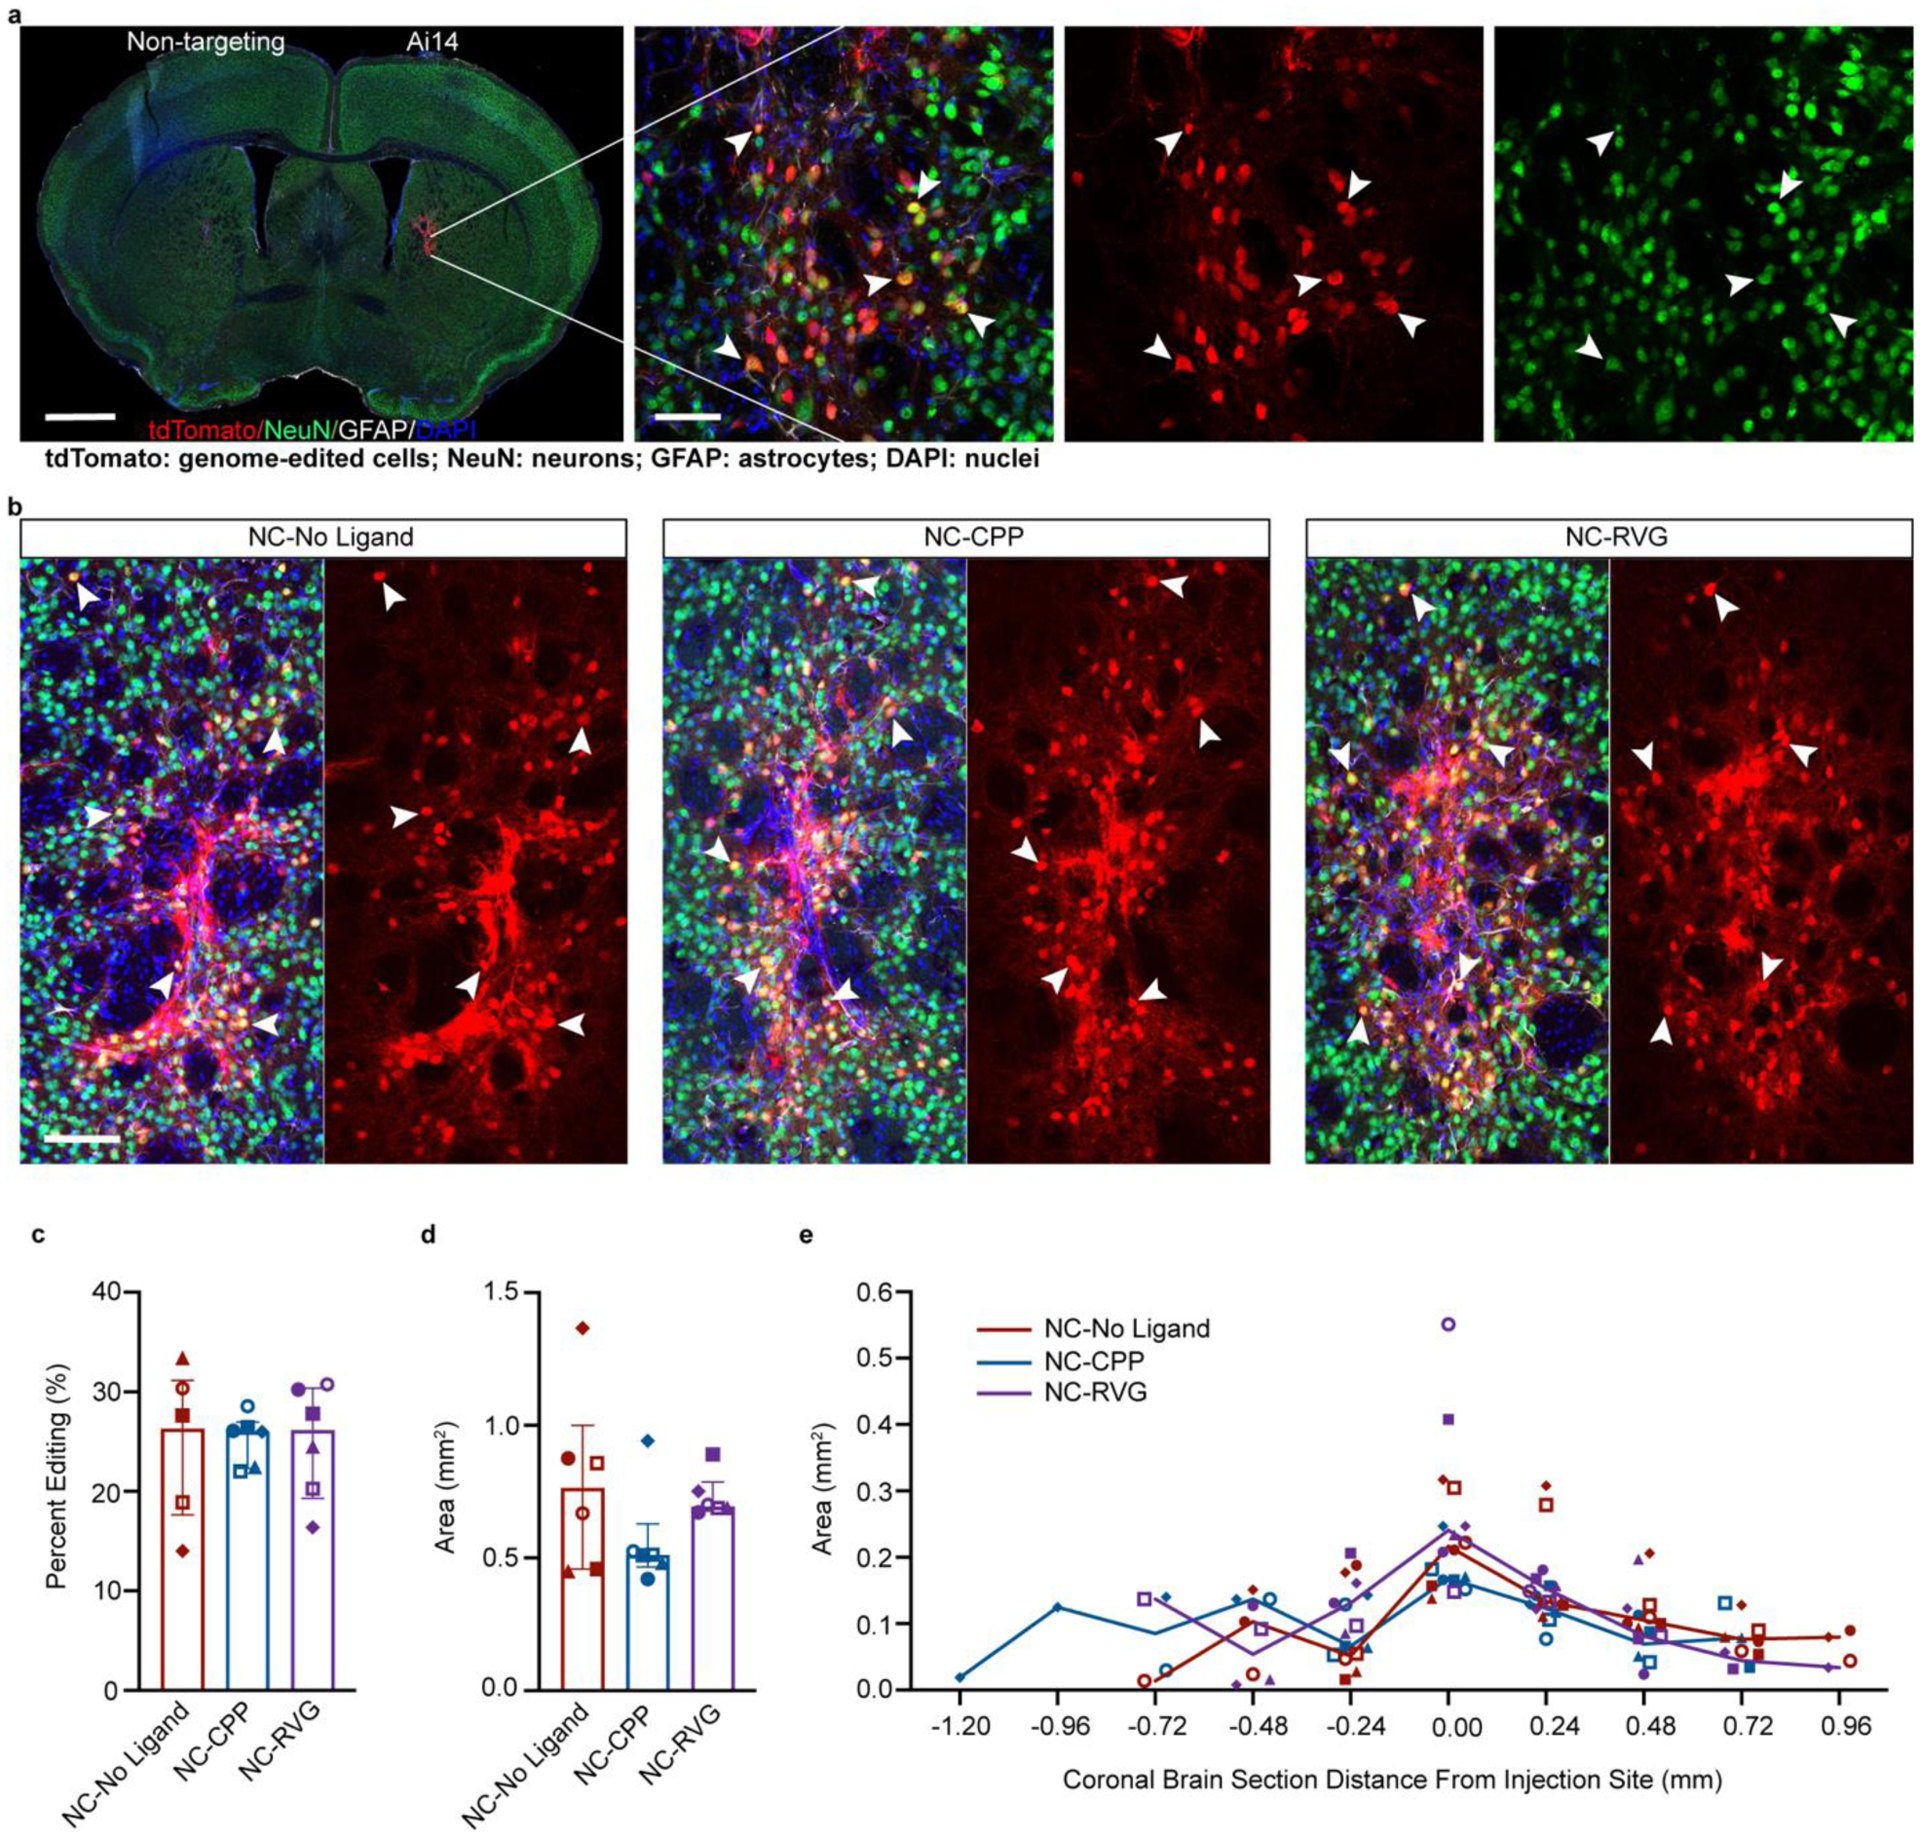
Figure 3. NC delivery of Cas9 RNP produces efficient in vivo neuronal genome editing in the striatum of Ai14 mice.

a, Coronal mouse brain section (scale = 1000 μm) and high magnification image (scale = 50 μm) of neuronal genome editing following NC injection (animal J11). Co-labeling (yellow; white arrowheads) of the neuronal marker NeuN (green) and tdTomato (red) indicates genome-edited neurons. b, Genome-edited neurons (yellow; white arrowheads) in the striatum of representative animals from each of the NC treatment groups (NC-No Ligand animal J12; NC-CPP animal J18; NC-RVG animal J5; Supp. Table 1). Scale bar = 100 μm. c, Percentage of neurons in the edited area expressing tdTomato in each NC treatment group. d, Sum of edited area size (region of interest area) across all coronal slices in each NC treatment group. e, Line graph of median edited area size for each treatment group at given distances rostral and caudal to the injection site. c and d, Graphs show median and interquartile range. Differences between groups were not statistically significant. c – e, Each animal is shown with a unique color and symbol. Photomicrographs show maximum intensity projection of three focal planes covering 10 μm. Individual channels were adjusted for brightness as needed (Supp. Table 4). CPP, cell-penetrating peptide; DAPI, 4′,6-diamidino-2-phenylindole; GFAP, glial fibrillary acidic protein; NC, nanocapsule; NeuN, neuronal nuclear protein; RVG, rabies virus glycoprotein.
