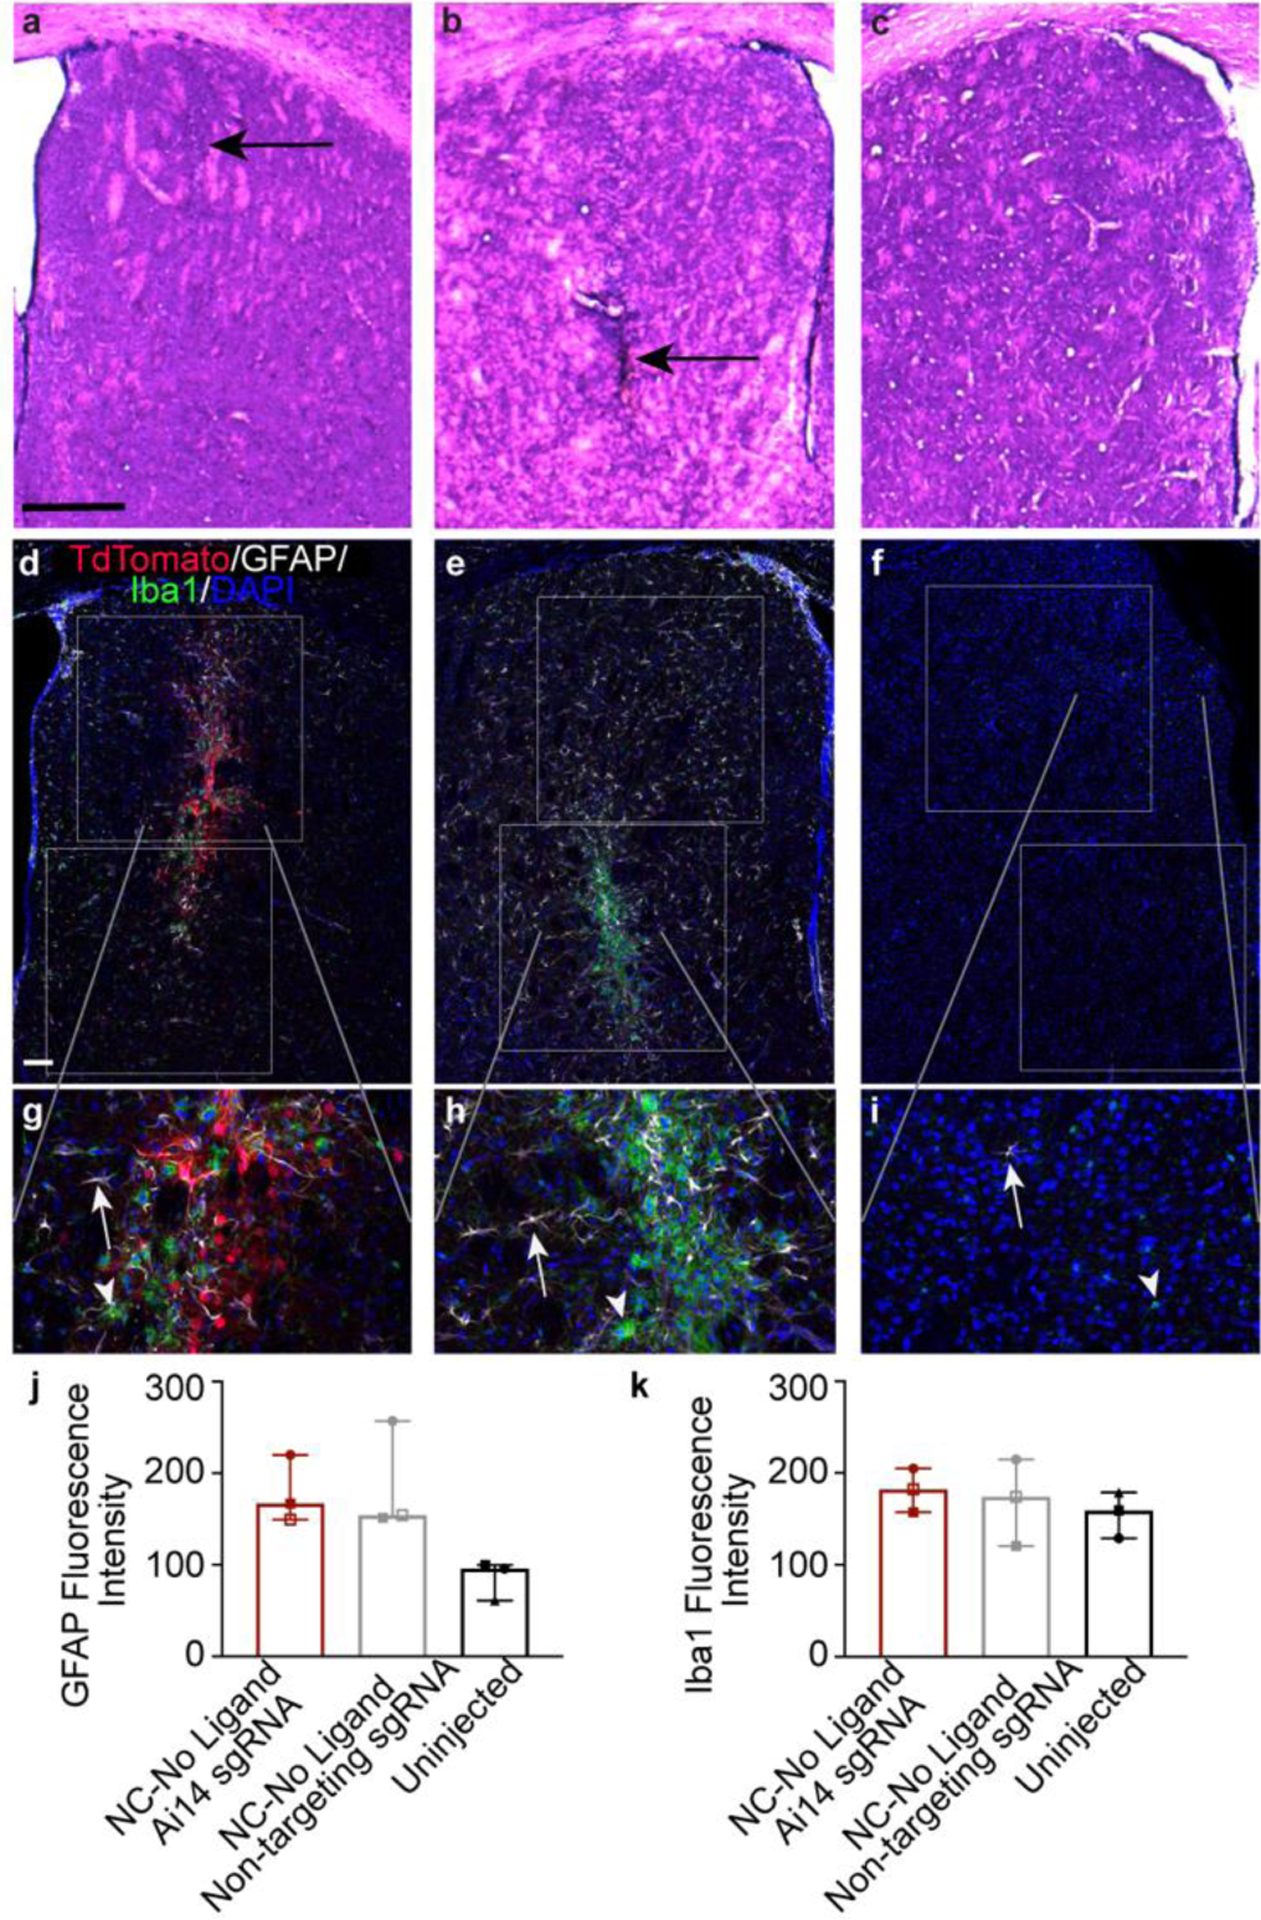
Figure 6. NC injection is not associated with a significant inflammatory response.

a – c, Hematoxylin and eosin (HE) stained mouse brain tissue at the injection site in the striatum showing linear focal areas of increased cellularity (black arrows) in each of the treatment groups (a, NC-No Ligand RNP with non-targeting sgRNA [animal J7 left hemisphere]; b, NC-No Ligand RNP with Ai14 sgRNA [animal J7 right hemisphere]; Uninjected hemisphere [animal UW8]; Supp. Table 1). Scale bar = 500 um. d – i, Fluorescence labeling in striatal tissue (same animals as a – c) of tdTomato (red), the astrocyte marker GFAP (white), the microglial marker Iba1 (green), and the nuclear marker DAPI (blue). White boxes show the regions of interest (ROIs) drawn for analysis of mean fluorescence intensity. The gray lines indicate where in the low magnification (d – f, scale = 100 μm) image each high magnification image (g – I, scale = 100 μm) is found. White arrows = astrocyte. White arrowheads = microglia. j and k, mean fluorescence intensity of (j) GFAP and (k) Iba1 expression. Graphs show group median and interquartile range. No significant differences were found between groups. Individual channels were adjusted for brightness as needed (Supp. Table 4). DAPI, 4′,6-diamidino-2-phenylindole; GFAP, glial fibrillary acidic protein; Iba1, ionized calcium binding adaptor molecule 1; NC, nanocapsule.
