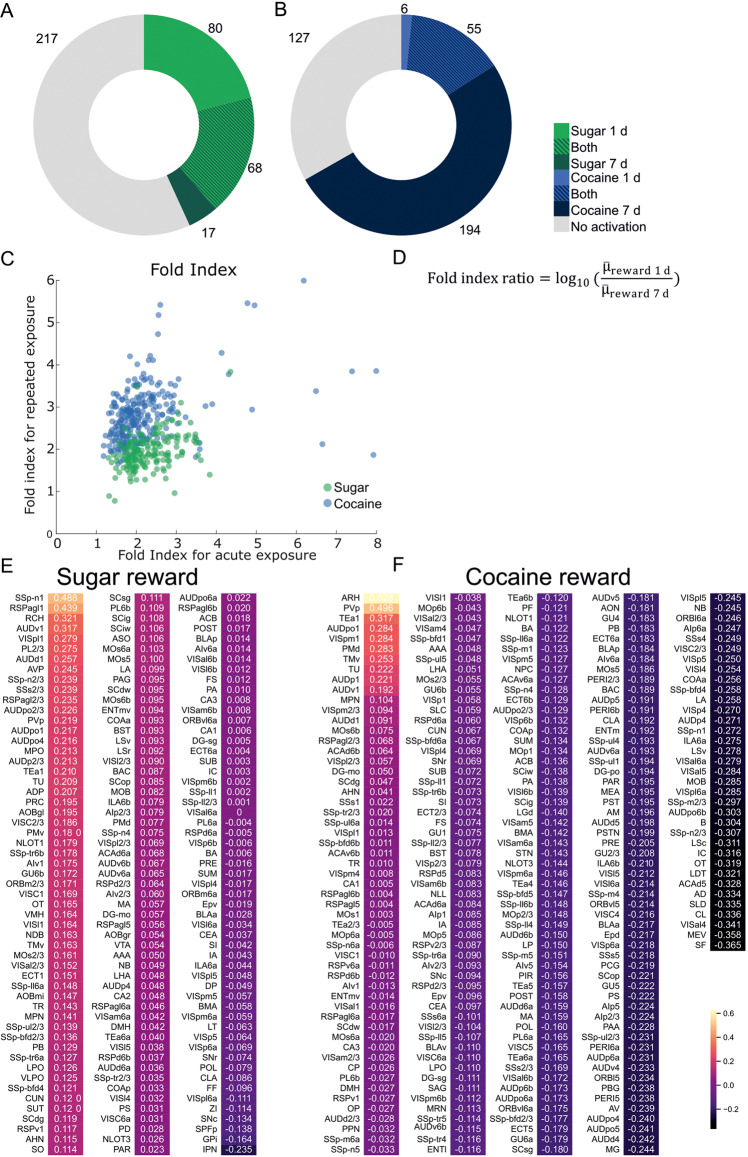
Fig. 3. c-Fos expression in the brain after acute and prolonged exposure to reward.
A, B Number of structures with elevated c-Fos level after natural (A) or pharmacological reward (B) treatment. C Graph shows fold indices for structures after either acute or prolonged exposure to either natural (green) or pharmacological (blue) reward exposure. D Fold index ratio equation used to compare effects of acute and prolonged reward exposure. E, F Individual fold indexes ratios for natural (E) and pharmacological (F) rewards. Fold index ratios were calculated for structures, which compared to control groups had a p-value < 0.1 either for 1 day or 7 days of reward treatment. For each structure p-value was calculated. First, a generalized linear model (GLM) was calculated. For each GLM a Dunnett’s test was performed. Finally, due to a large number of structures a Benjamin-Hochberg false discovery rate correction was performed on p-values with a 0.1 cut-off. N Water = 7, N Sugar 1 d = 5, N Sugar 7 d = 7, N Saline = 7, N Cocaine 1 d = 6, N Cocaine 7 d = 6.

