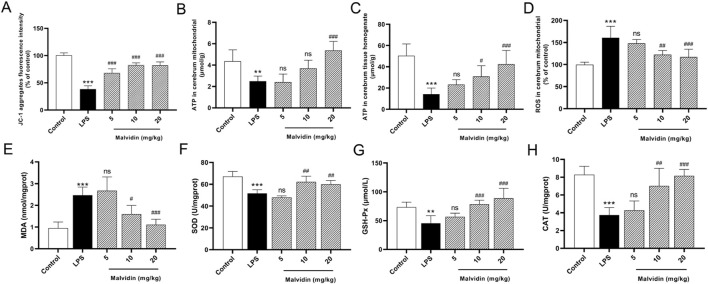
FIGURE 2.
Roles of malvidin on LPS-induced mice cerebrum mitochondrial dysfunction and ROS accumulation. (A) JC-1 aggregates fluorescence intensity in the purified cerebrum mitochondrial was detected using mitochondrial membrane potential assay kit (n = 6). (B, C) ATP contents were measured both in the purified cerebrum mitochondrial and cerebrum tissue homogenates using ATP content assay kit (n = 6). (D) ROS levels were detected in the purified cerebrum mitochondrial using ROS assay kit with fluorescent probe H2DCFDA (n = 6). The MDA contents (E), SOD activities (F), GSH-Px activities (G), CAT activities (H) in cerebrum tissue homogenates were measured using biochemical kits (n = 6). * represents comparison between LPS group and control group, whereas # indicates analysis among LPS group and malvidin pretreatment groups. # is p < 0.05, **/## is p < 0.01, ***/### is p < 0.001, and ns is p > 0.05.

