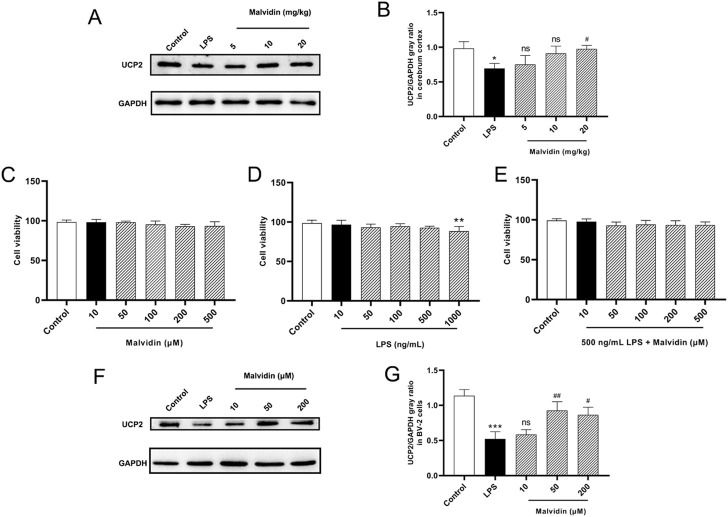
FIGURE 3.
Malvidin enhanced UCP2 protein expression in SAE mice cerebrum and LPS stimulated BV-2 cells. (A) UCP2 protein expression levels in the cerebrum tissues were detected using immunoblotting assays. GAPDH was used as an internal reference. (B) Gray ratio analysis of UCP2/GAPDH in (A) using ImageJ and excel software (n = 3). (C) Cell viability determination of BV-2 after stimulation with malvidin (10, 50, 100, 200, 500 μM) for 24 h using CCK8 assays. (D) Cell viability determination of BV-2 after stimulation with LPS (10, 50, 100, 500, 1000 ng/ml) for 24 h using CCK8 assays. (E) Cell viability determination of BV-2 after co-stimulation with 500 ng/ml LPS and malvidin (10, 50, 100, 200, 500 μM) for 24 h using CCK8 assays. (F) Immunoblotting assays detection of UCP2 protein expression levels in the BV-2 cells incubated with or without malvidin (50, 100, 200 μM) for 1 h followed by stimulation with 500 ng/ml LPS for 24 h. (G) Gray ratio analysis of UCP2/GAPDH in (F) using ImageJ and excel software (n = 3). * represents comparison between LPS group and control group, whereas # indicates analysis among LPS group and malvidin pretreatment groups. */# is p < 0.05, **/## is p < 0.01, ***/### is p < 0.001, and ns is p > 0.05.

