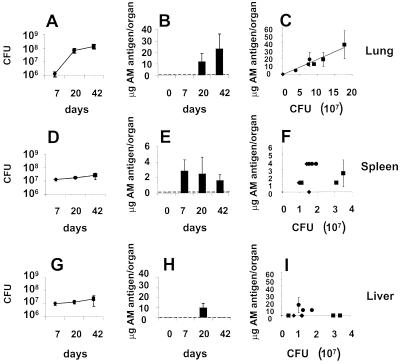
FIG. 5.
Capture ELISA of AM in organ homogenate compared to organ CFU. The number of CFU in the lungs (A), spleens (D), or livers (G) of mice infected with M. tuberculosis Erdman was determined 7, 20, and 42 days after infection. Each value represents the average of three animals. Error bars show the standard deviation of the mean. Organ homogenates were assayed for micrograms of MAb 9d8(2a) AM antigen/organ in the lung (B), spleen (E), or liver (H) 0, 7, 20, and 42 days after infection. The detection limit of the assay is indicated by the dotted line. Each value represents the average of the three animals, using two measurements for each animal. Error bars represent the standard deviation of all six measurements. The CFU data for each animal organ were also related to the number of micrograms of MAb 9d8(2a) AM antigen in that animal organ (C, F, and I) for all day-7 (⧫), day-20 (●), and day-42 (■) mice. Each value represents the average of the two measurements of MAb 9d8(2a) AM antigen concentration per animal organ, and error bars represent the standard deviation of those two measurements. The point (⧫) at the bottom left of Panel C represents three mice that have the same apparent graphic value.

