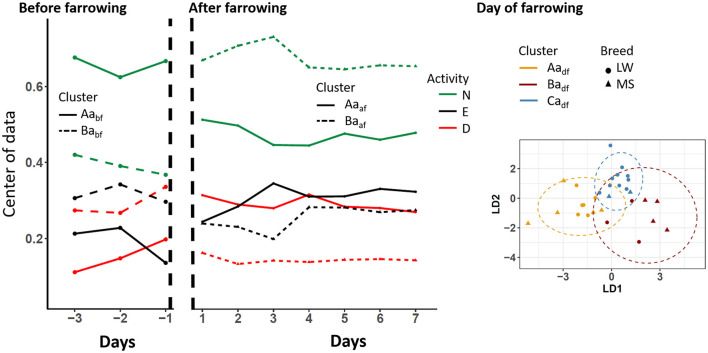
Figure 4.
Longitudinal changes in sow standing activity according to the clusters that were identified before, after, and on the day of farrowing. D, drinking; E, eating; N, something other; LW, Large-White, MS, Meishan. The centers of data are shown in the periods before and after farrowing because the longitudinal analyses were applied. The two first components of the linear discriminant analysis are shown on the day of farrowing.

