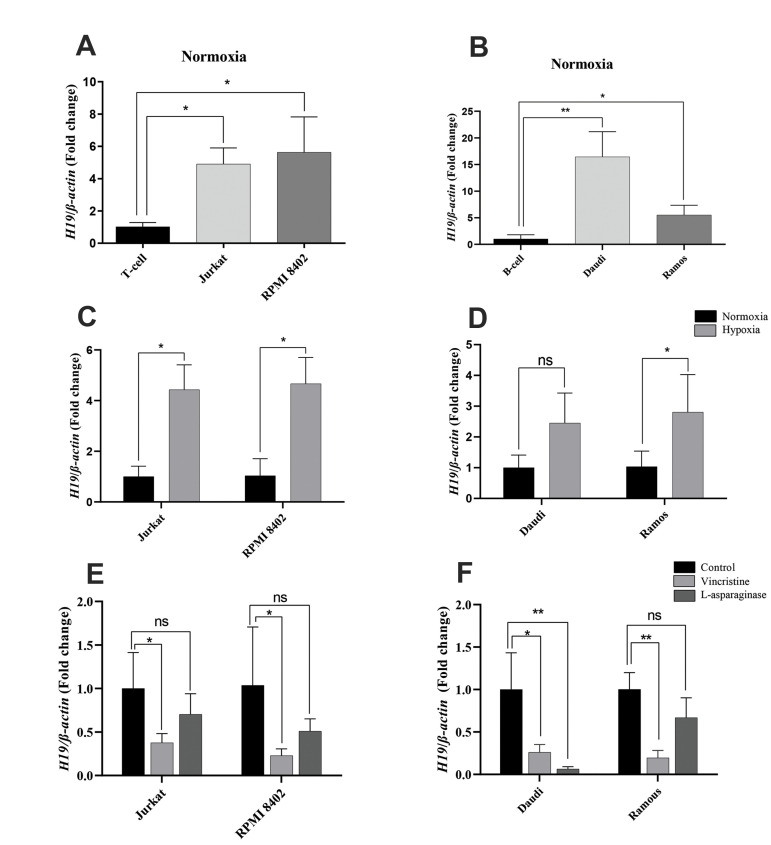
Fig 2.
H19 expression in ALL cell lines. Gene expression was assessed by q-RT PCR. A, B. H19 expression was analyzed in both B and T ALL cell lines and compared to normal B and T cells, respectively. C, D. Analysis of H19 expression in cell lines after 24 hours of exposure to hypoxic stress. E, F. Expression of H19 was evaluated after treatment with VCR and ASP. The data are from three independent experiments, each done in triplicate. ALL; Acute lymphoblastic leukemia, q-RT PCR; Quantitative real-time polymerase chain reaction, VCR; Vincristine, ASP; L-asparaginase, ns; Not significant, *; P<0.05, and **; P<0.01.

