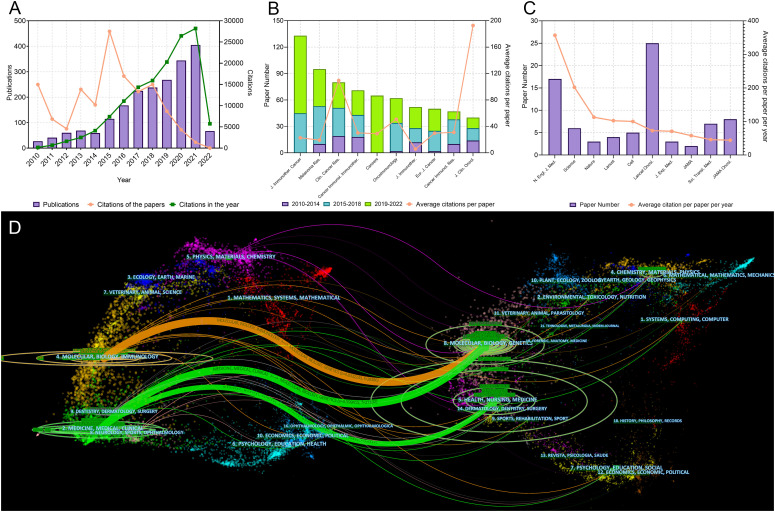
Figure 1.
(A) Publication and citation number from 2010 to 2022 of the papers on melanoma immunotherapy. The green line indicates the total citations of papers published each year. The orange line indicates the total citations of all papers each year. (B) Paper numbers and average citations per paper of the top-10 productive journals. (C) Top-10 journals with the most citations per paper per year. (D) The dual-map overlay of journal categories. The left nodes represent citing journals and the right nodes represent cited journals. The curves represent the citation relationship.

