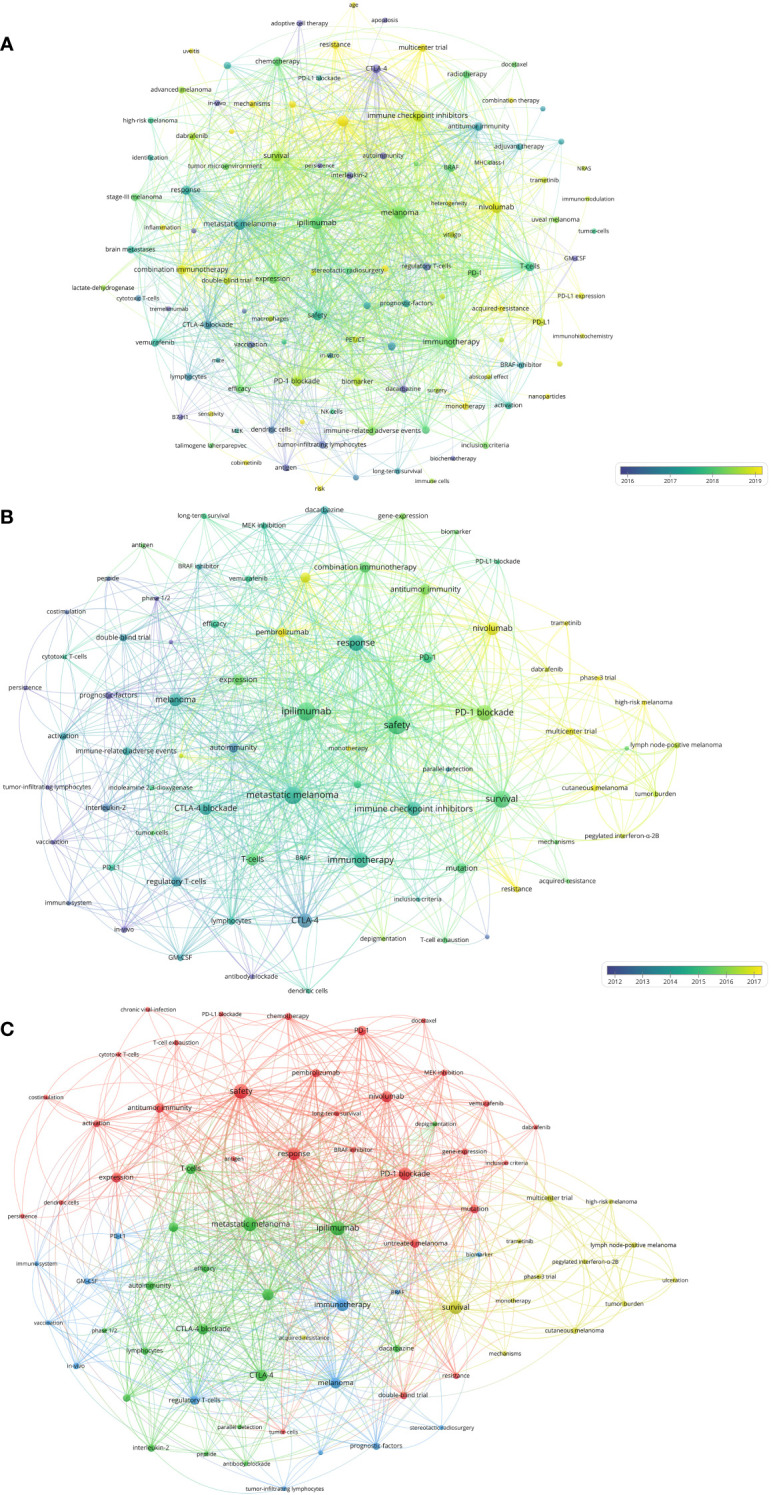
Figure 8.

(A) Network visualization of keywords that occurred at least 10 times in the papers. (B) Network visualization of keywords that occurred at least twice in the top-papers. (C) Network visualization of keywords that occurred at least twice in papers published in major journals between 2020 and 2022. The circle size represents the number of papers. The breadth of the curves represents the connection strength.
