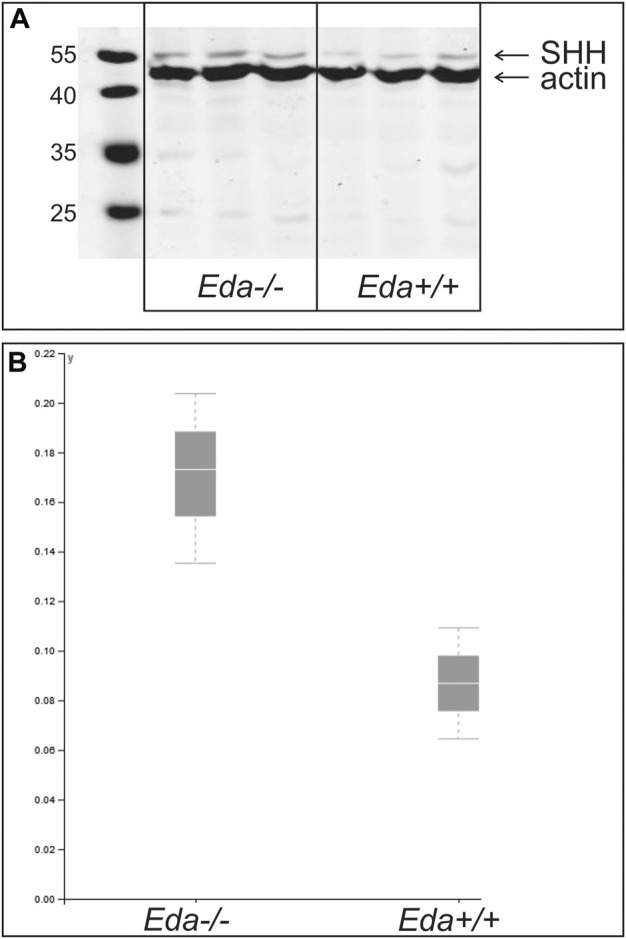
FIGURE 6.

Relative amount of Shh protein at ED14.5 in Eda−/− and Eda+/+ mice. A representative WB experiment of three independent analyses is shown in the image (A) and graph (B). Resulting images were scanned and protein quantification was performed using VisionCapt software. Intensity of bands was quantified normalized to actin control. The analysis was performed in three independent harvestings. The normality of the data was tested by Shapiro-Wilk test and consequently One Way ANOVA test was used to determine the differences of the relative protein levels in Eda−/− compared to control Eda+/+. The differences of relative amounts of Shh protein quantified to the actin levels were not significant.
