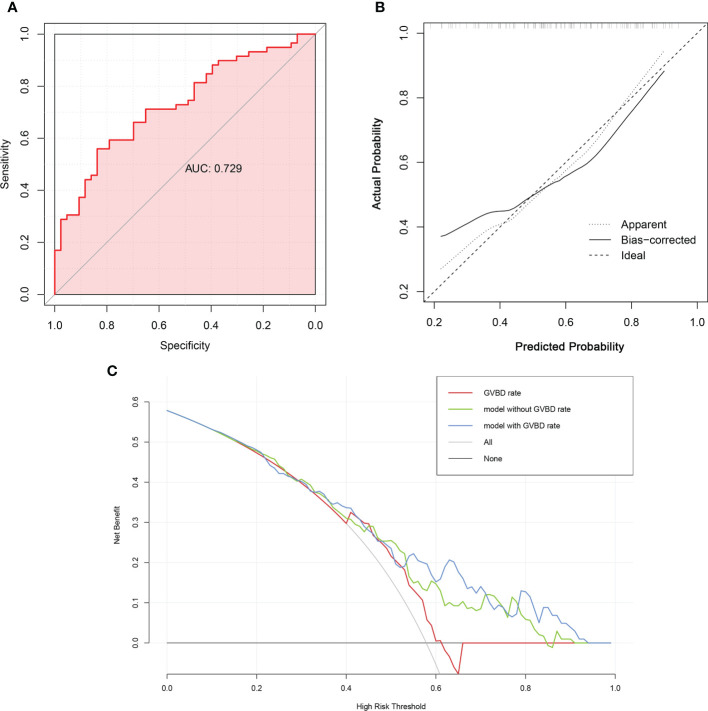
Figure 2.
The validation of the multivariate logistic regression model. (A). The discrimination was evaluated using the area under curve (AUC) of the receiver operating characteristic curve (ROC). (B). The calibration was measured using calibration curve. The x-axis was the predicted probability of pregnancy, and the y-axis indicated the actual observed probability of pregnancy. (C). Decision curve analyses of logistic regression models. The net benefit over a spectrum of probability thresholds was calculated to illustrate the accuracy of three models using decision curve analyses. The red curve represented a logistic regression model using GVBD rate only. The green line assumes the nomogram without GVBD rate, whereas the blue one plotted the nomogram with GVBD rate.

