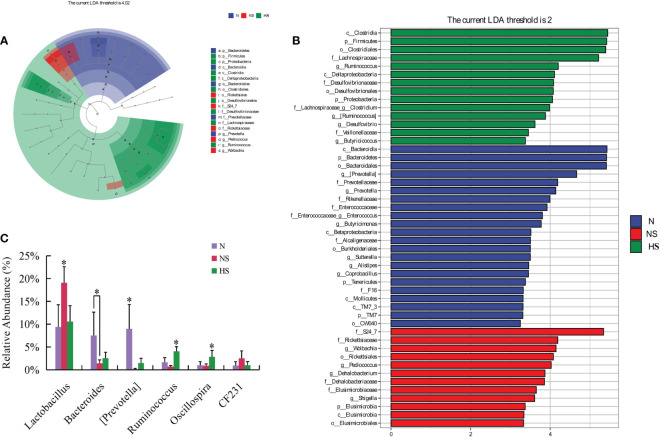
Figure 6.
(A) LEfSe taxonomic cladogram. The colored nodes from the inner circle to the outer circle represented the hierarchical relationship of all taxa from the phylum to the genus level. Taxa enriched in HS, NS, and N group are shown in green, red, and blue, respectively. The non-significant changes were colored white. The diameter of each small circle represents the taxa abundance. (B) Enriched taxa with a linear discriminant analysis score = 2 are shown in the histogram. The longer bars of the histogram represent the more significant phylotype microbiota upon comparison. (C) Species with significant differences at the genus level. Unmarked data indicate no significant difference (P > 0.05); *P < 0.05; n = 4.

